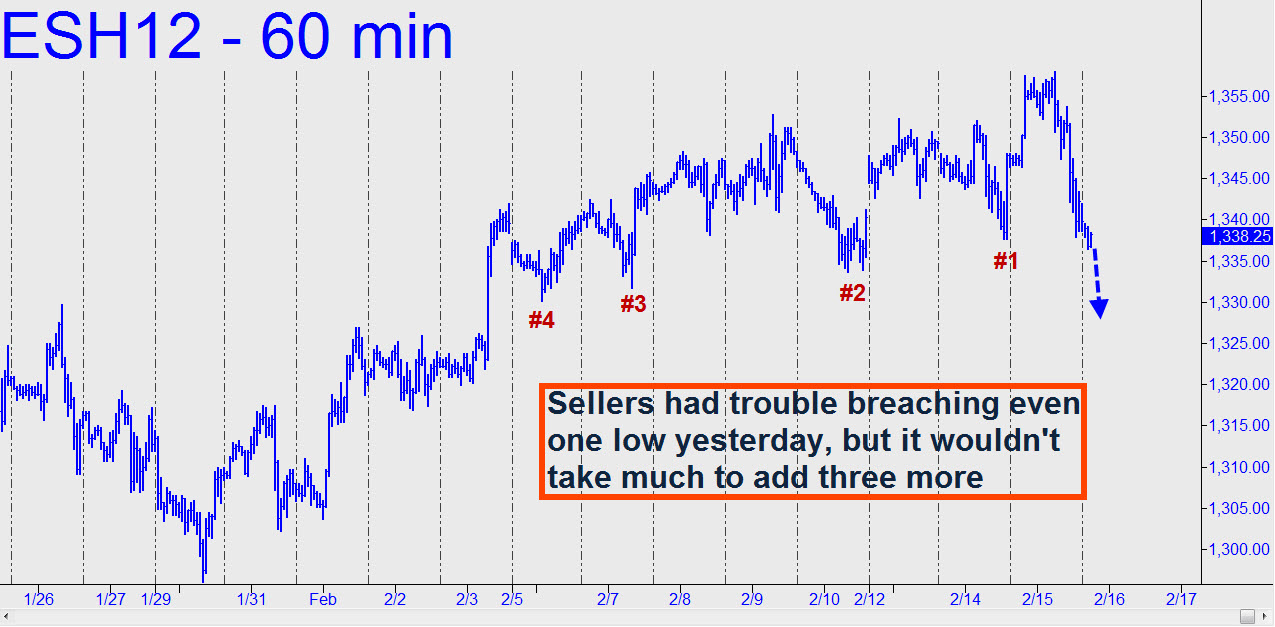
 It was all downhill yesterday, DaBoyz having wrung as much fear and panic from bears as they could before the opening bell. I doubt that bears will have much to celebrate in the days ahead, however, since the selloff, ostensibly the worst of 2012, has actually been pretty feeble so far. Notice how the futures had to be dragged lower, kicking and screaming, to breach even a single important low on the chart. And although a second at 1333.75 looks ready to give way, even if it does there will have been too much hesitation about it. We should be ready to put our skepticism aside, however, if a downdraft overnight or Thursday morning pushes aside external lows #3 and #4 (see inset). In any case, as we went to press there were no compelling correction targets where camouflageurs might look to bottom-fish. If you’re keen on finding one, though, I’ll suggest doing so on the 20-minute chart or lower.
