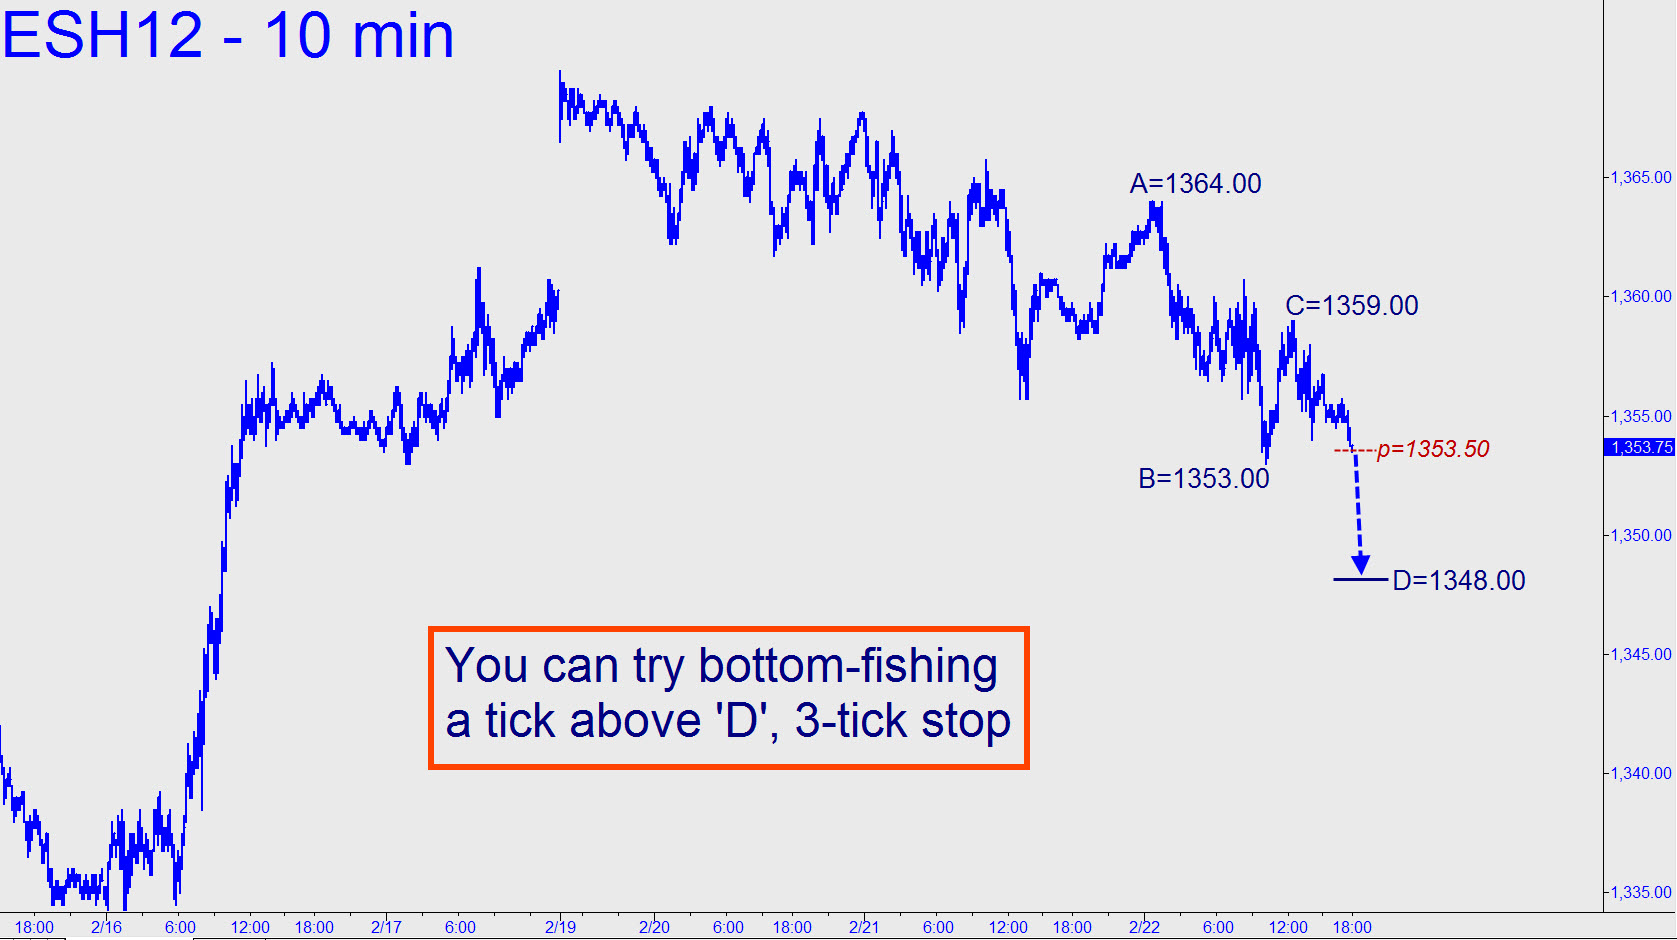
 Kinda scary when DaBoyz can only extort a measly ten-minute rally from the latest resurrection of Greece. That’s how long the short-covering frenzy lasted on Monday night when markets opened in holiday-eve trading. The choppy selloff since has produced a forest of corrective ABC patterns, but the one I’ll suggest using for purposes of predicting where it might end is shown in the inset. It sports a ‘D’ target at 1348.00, a hidden support so beautifully isolated that you can try bottom-fishing with a 1348.25 bid, stop 1347.50. Camouflage is preferred, as usual, but this gambit is the first I’ve seen in a while that can be attempted the way we used to do it before ‘camo’ was invented. _______ UPDATE (3:07 p.m. EST): The futures dipped no lower than 1350.25 during off-hours trading, denying us a boarding opportunity if a straight bid was used. However, if you’d used camouflage to get in, a good opportunity arrived on the one-minute chart at around 9:14 a.m. EST, when a minor, uptrending ABC tripped an entry signal at 1353.50. Check it out if you are skeptical that even a novice Pivoteer could not have made money on this one.
