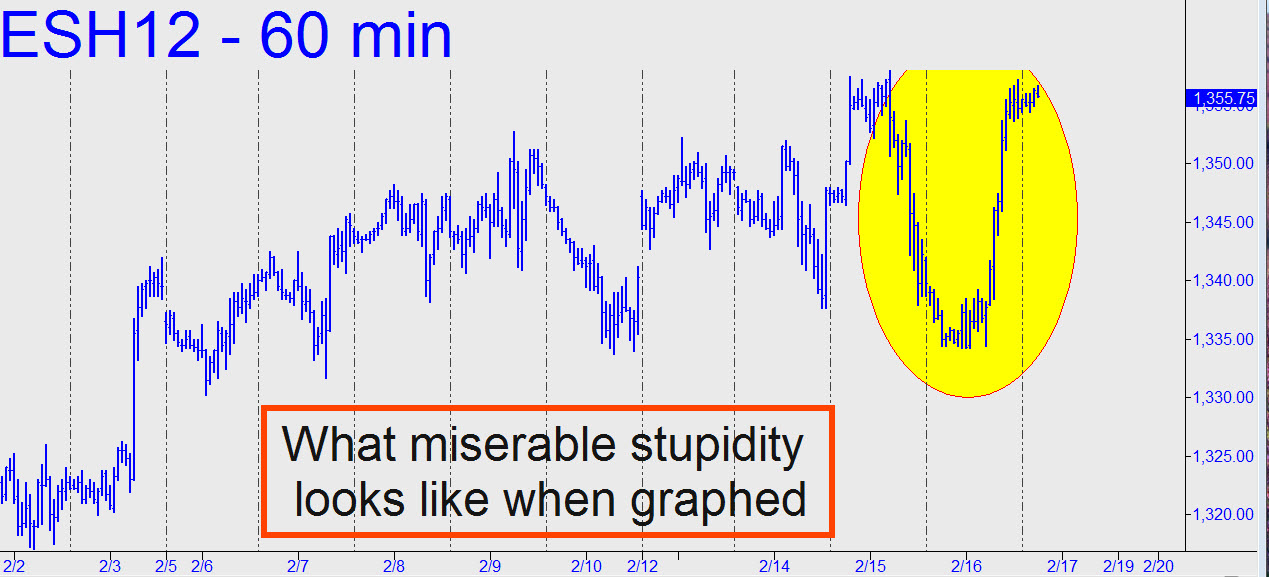
 Wednesday night’s bullish tout anticipated the miserable stupidity of yesterday’s rebound, which effectively transformed the previous day’s equally stupid decline into a v-shaped swoon. Where to next? Probably higher, but does anyone really care? In any event, the rally created a bullish impulse leg on the hourly chart — one with a short k-A segment that in theory will require little corrective action to set up another big bull leg. I doubt this will happen today, and so even on a camouflage basis, I cannot enthusiastically recommend looking for a way to get on board — especially on a Friday, when the pathological forces that drive the markets are likely to be at their strongest.
