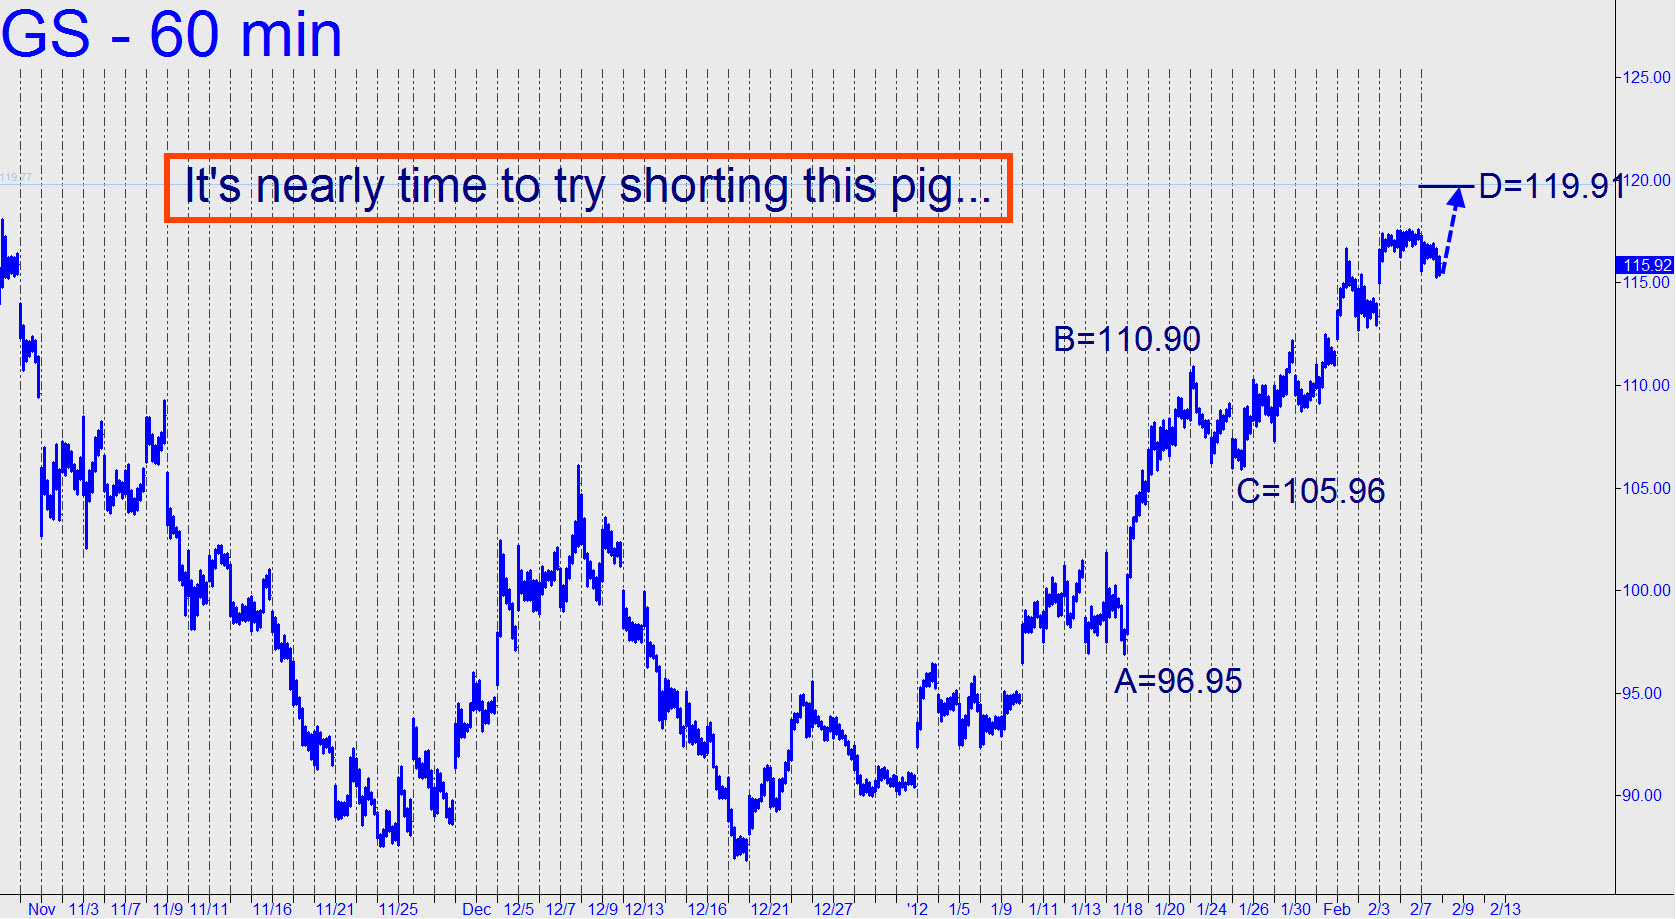
 We’ll use the 119.91 target to get short, whack-a-mole style, if Goldman should poke its ugly little head up. This is slightly lower than the Hidden pivot target given here earlier, but the pattern shown amply supports the new number. I’ll specifically recommend that you buy two March 110 puts (or multiple thereof) with GS trading within a few cents of the target. Stop yourself out if the puts trade for 20 cents less than you paid for them. ________ UPDATE (February 22): We’ll put this one aside for now, since the stock’s struggle to reach the target has become too tedious to command our earnest attention.
