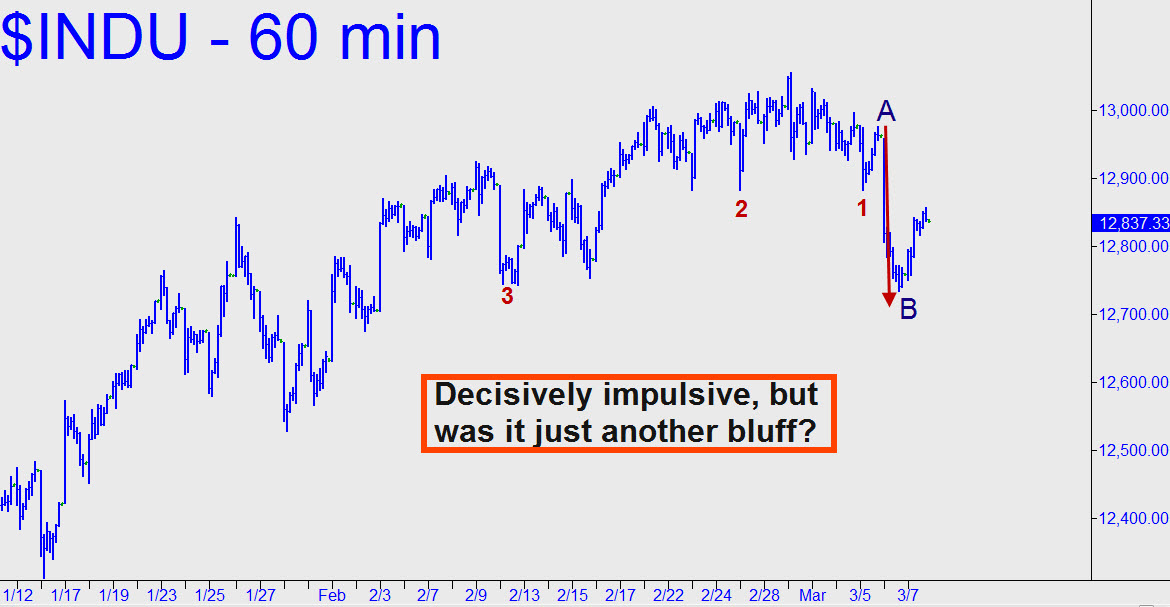
 The selloff on Tuesday was strongly impulsive, but we’ll need to see how the C-D follow-through leg plays out before we can disdain it as a bluff. One financial-page story noted that it’s been a long, long while since stocks failed to bounce back after similar onslaughts in the past. Although it’s certain that, one of these times, the bounce everyone is looking for will not come, for now — fully three years into the Mother of All Bear rallies — we’ll have to continue to give bulls the benefit of the doubt. Regardless, we should watch for signs of fatigue at exactly 12859.77, the Hidden Pivot midpoint of the rally pattern (15-minute) a=12758.85 (3/7 at 10:30 a.m.); b=12842.17. If it’s breached, look for more upside over the near term to 12901.43, its ‘d’ sibling. Either number can be shorted with the usual, preternaturally tight stop-loss or via camouflage. _______ UPDATE (March 9, 1:06 a.m. EST): The Indoos could still roll over in the manner suggested above, but the strength of yesterday’s rally argues against this. If the blue chip average were to close above 12997, bulls will begin the new week on Sunday with a running start.
