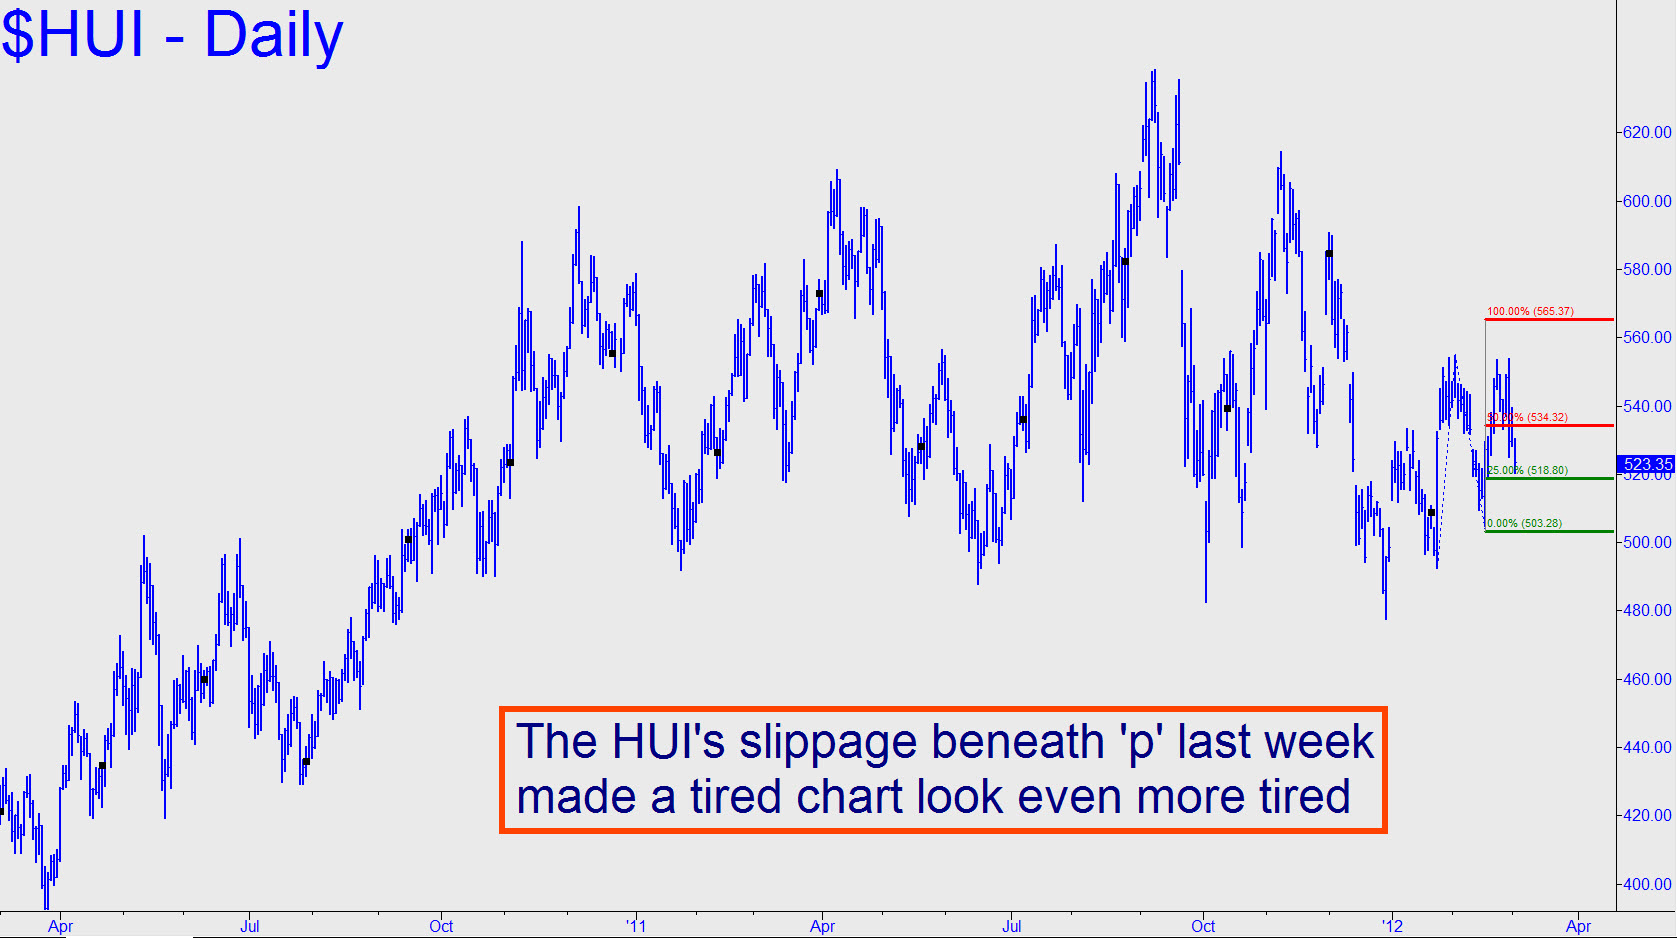
 The HUI’s tiredness is too obvious to require explaining — just look at the chart — and last week’s dispiriting price action did nothing to improve the outlook for the near term (i.e., 6-10 days). If this vehicle were getting ready to launch, it likely would have done so from the lower red line shown in the chart. That’s the ‘p’ midpoint of a bullish pattern (still) projecting to 565.37, but it became resistance again last Wednesday when HUI crashed it, nearly returning to the 25% line in the process. While this vehicle doesn’t look like it’s about to go to hell, we should be prepared for a tedious, trying stay in purgatory. The outlook would swing in bulls’ favor if they can end this week above the 534.32 midpoint.
