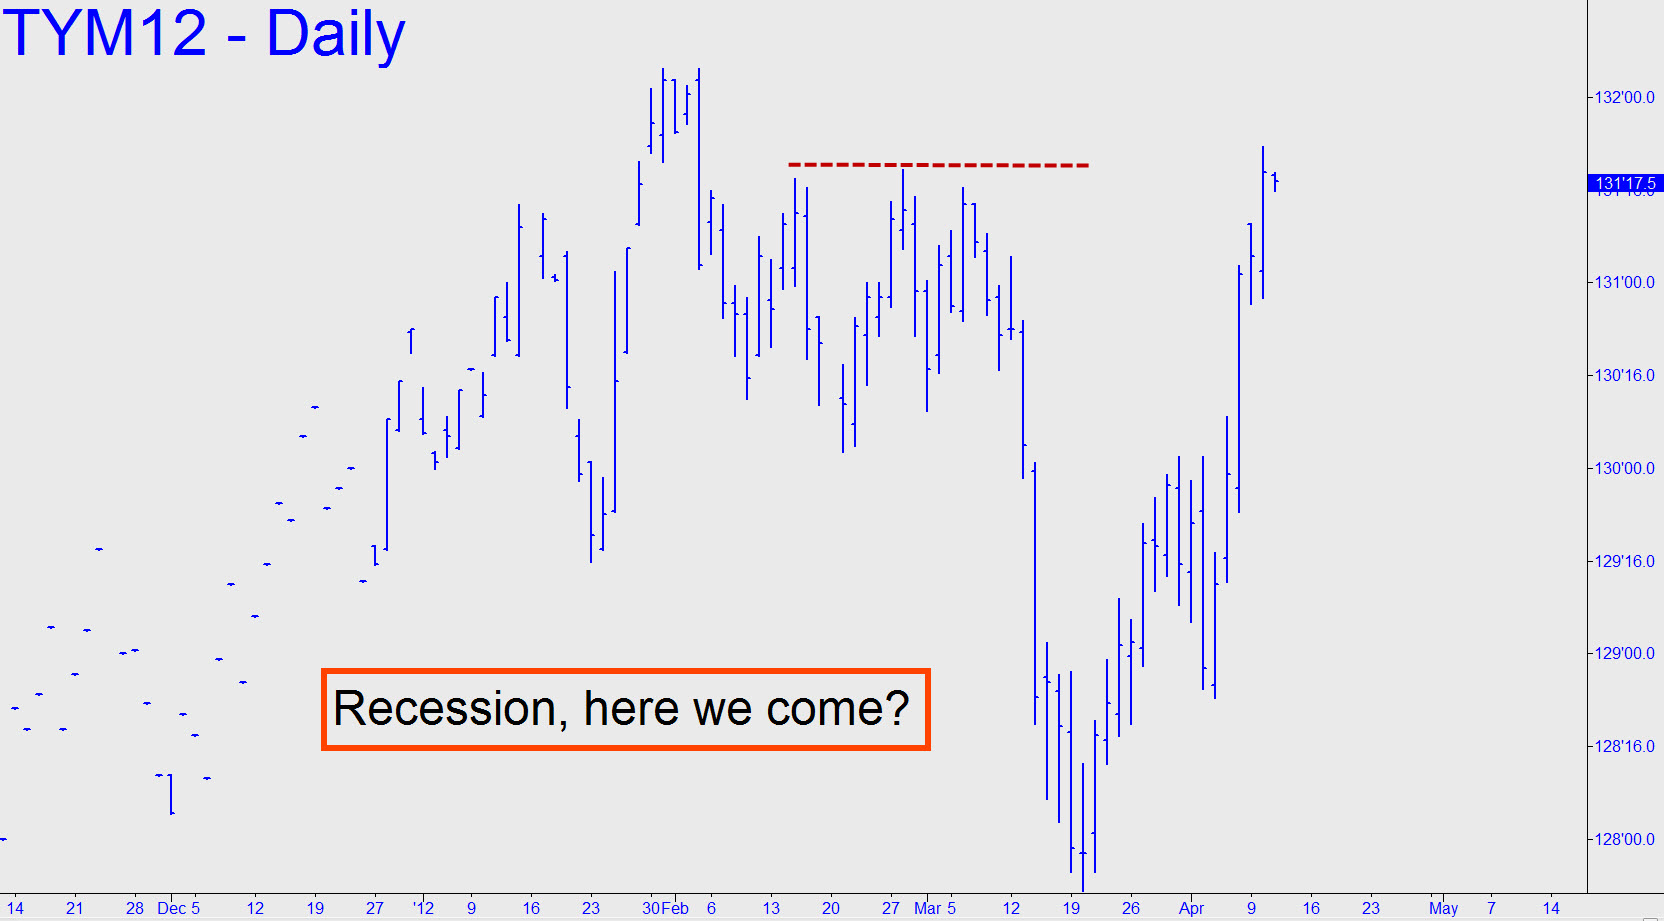
 I implied in a commentary earlier this week that a push above February’s 131^20 peak would be strong evidence the U.S. is headed back into statistical recession (even though The Great Recession has been with us for years), so yesterday’s rally is quite significant in technical terms. We can gauge this vehicle’s strength in the days ahead by monitoring the pullback that has yet to occur. In the meantime, a Ten-Year Note trading below 2% would indicate a more than merely moribund economy.
