
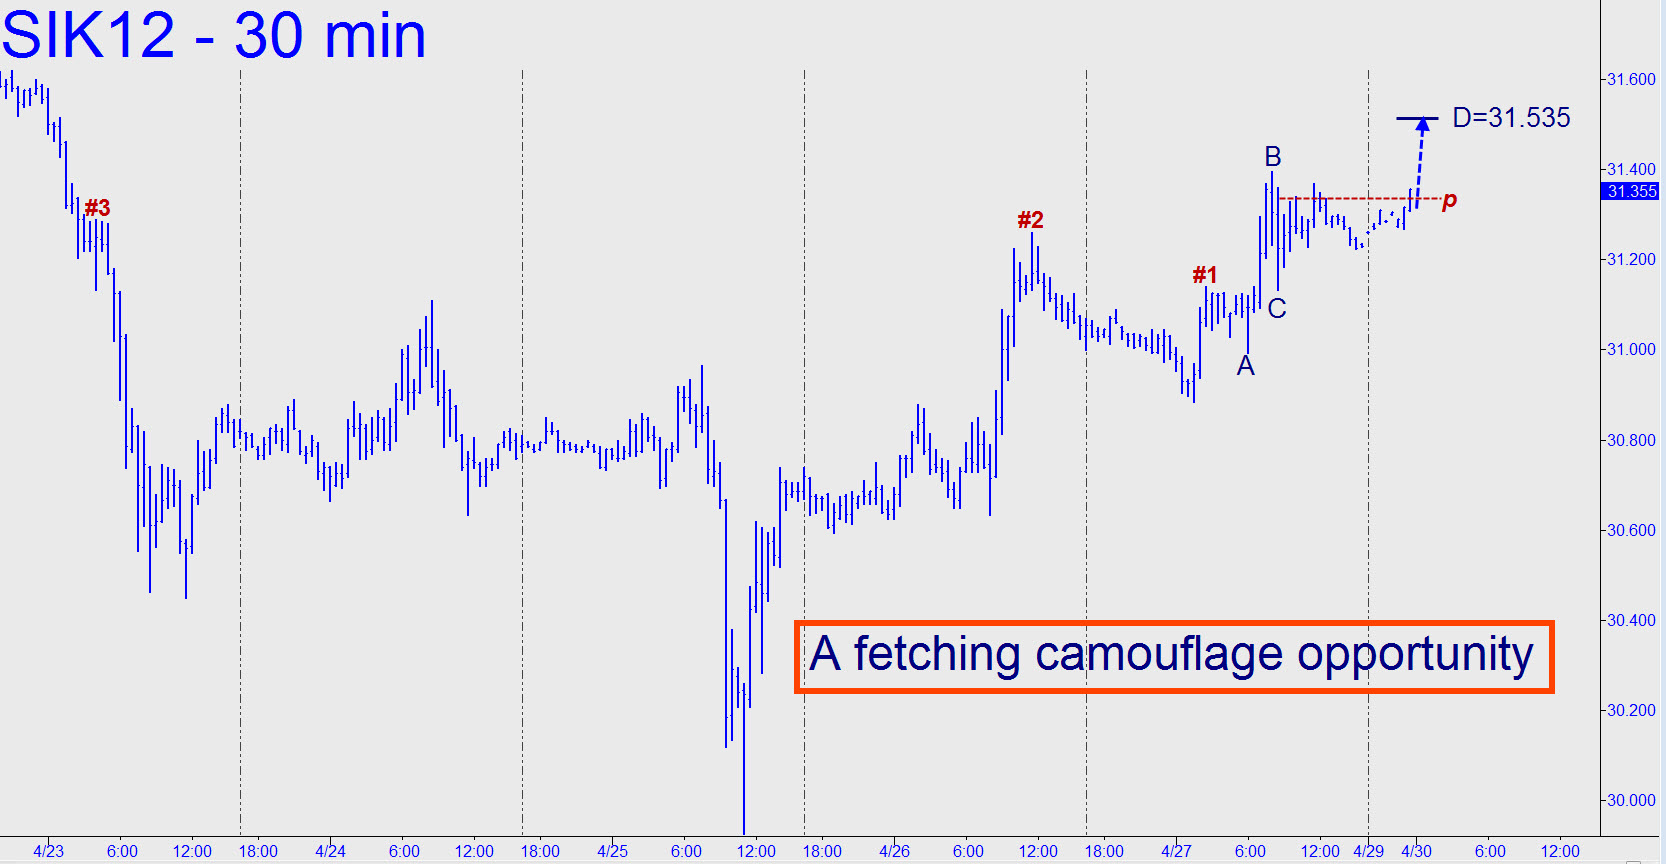
 The picture-perfect ‘camo’ pattern shown in the chart signaled a long entry at 31.235 for Pivoteers who were on the alert Friday morning. Since my tout was not likely sufficiently explicit to have done much more than pique your interest, however, I won’t be establishing a tracking position. (Also, as a practical matter, a ‘camo’ entry on a pattern of this size would have entailed initial risk of $500 per contract. Lowering theoretical risk to our rules-based threshold of $70 (or so) would have required entry on a chart of lesser degree.)
From an analytical standpoint, night owls should note that the ‘C-D’ leg has already exceeded its 31.335 mispoint resistance, implying that this burst will continue to at least 31.535, its ‘D’ sibling. Any higher would suggest bulls are eager to run as the new week begins. _______ UPDATE (12:22 p.m. EDT): Interesting coincidence, but the above tout went out Sunday evening exactly as May Silver was achieving its ill-fated overnight high. Unlike gold, however, the subsequent plunge cannot yet be called a swoon because the lost value has yet to be recouped. The action is short-term bearish, since it generated a downtrending impulse leg on the hourly chart. However, if Silver is to get back on a bullish track, we should see a harbinger of this in the form of a rebound from the midpoint Hidden Pivot of (30m) a=31.380 at 2:30 a.m. on 4/30; b=30.550 at 10 a.m., and c=?.