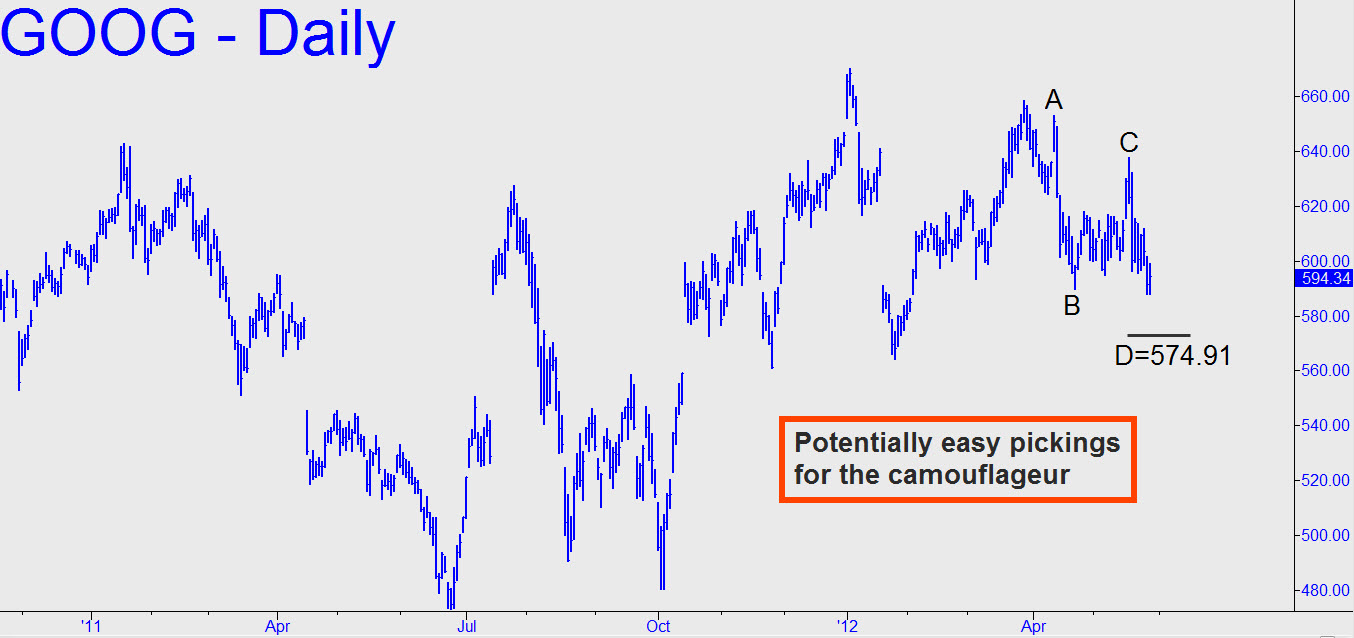
 GOOG appears bound at least $20 lower, to the 574.91 ‘D’ target of the orthodox pattern shown. This stock has always been easy pickings on the 15-minute chart, so I’ll suggest camouflageurs start looking there for the expected turn. If you’d prefer to use a straight buy order, try a 574.97 bid, stop 574.84, good-till-canceled. _______ UPDATE (June 1): The stock gapped down $10 on the opening, printing 571.79 to begin the day and negating the trade suggested above. (Side note: If you had had a straight bid in at the bell along with the stop, the orders might have been filled at the same price — i.e., a scratch, less commissions.) With all of the small stuff used up, it’s time to open our bearish imagination to the prospect of a fall to 435.90, the ‘p’ midpoint associated with a ‘D’ target at — better sit down for this, Google fans — 201.55. Here are the coordinates, from the weekly chart: A=716.00 (12/28/07); B= 247.30 (11/21/08); and C=670.25
