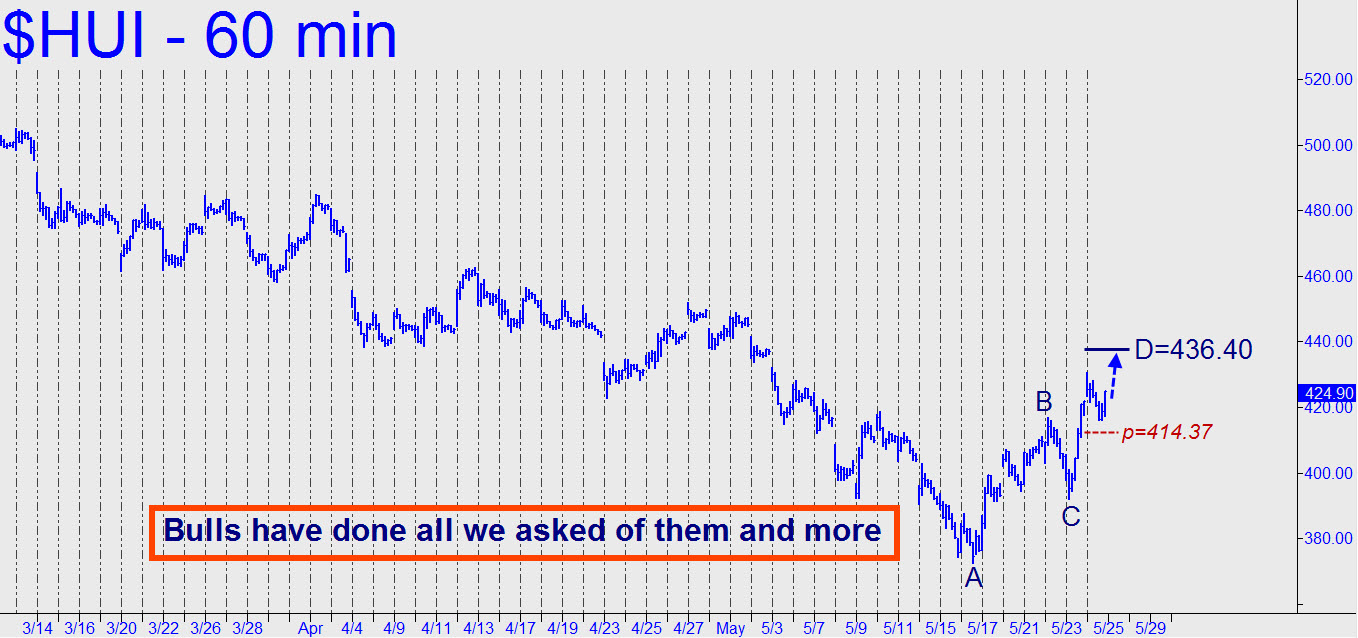
 The Gold Bugs Index has done all we asked of it and more, refreshing the bullish vitality of the hourly chart with a push past an ‘external’ peak recorded on May 4. We can use a Hidden Pivot at 436.40 (see inset) as a minimum upside objective for the near term, but if HUI should pull back to the 414.37 midpoint associated with that number, Pivoteers can try bottom-fishing on the 5-minute chart or less. ______ UPDATE (May 30, 1:20 a.m. EDT): From a recent high of 433.02, HUI has pulled back to within less than a point of the 414.37 midpoint flagged above. The implication is that this vehicle has bottomed and can be bought via camouflage. I suggest using the one-minute chart to reduce theoretical risk to a minimum.
