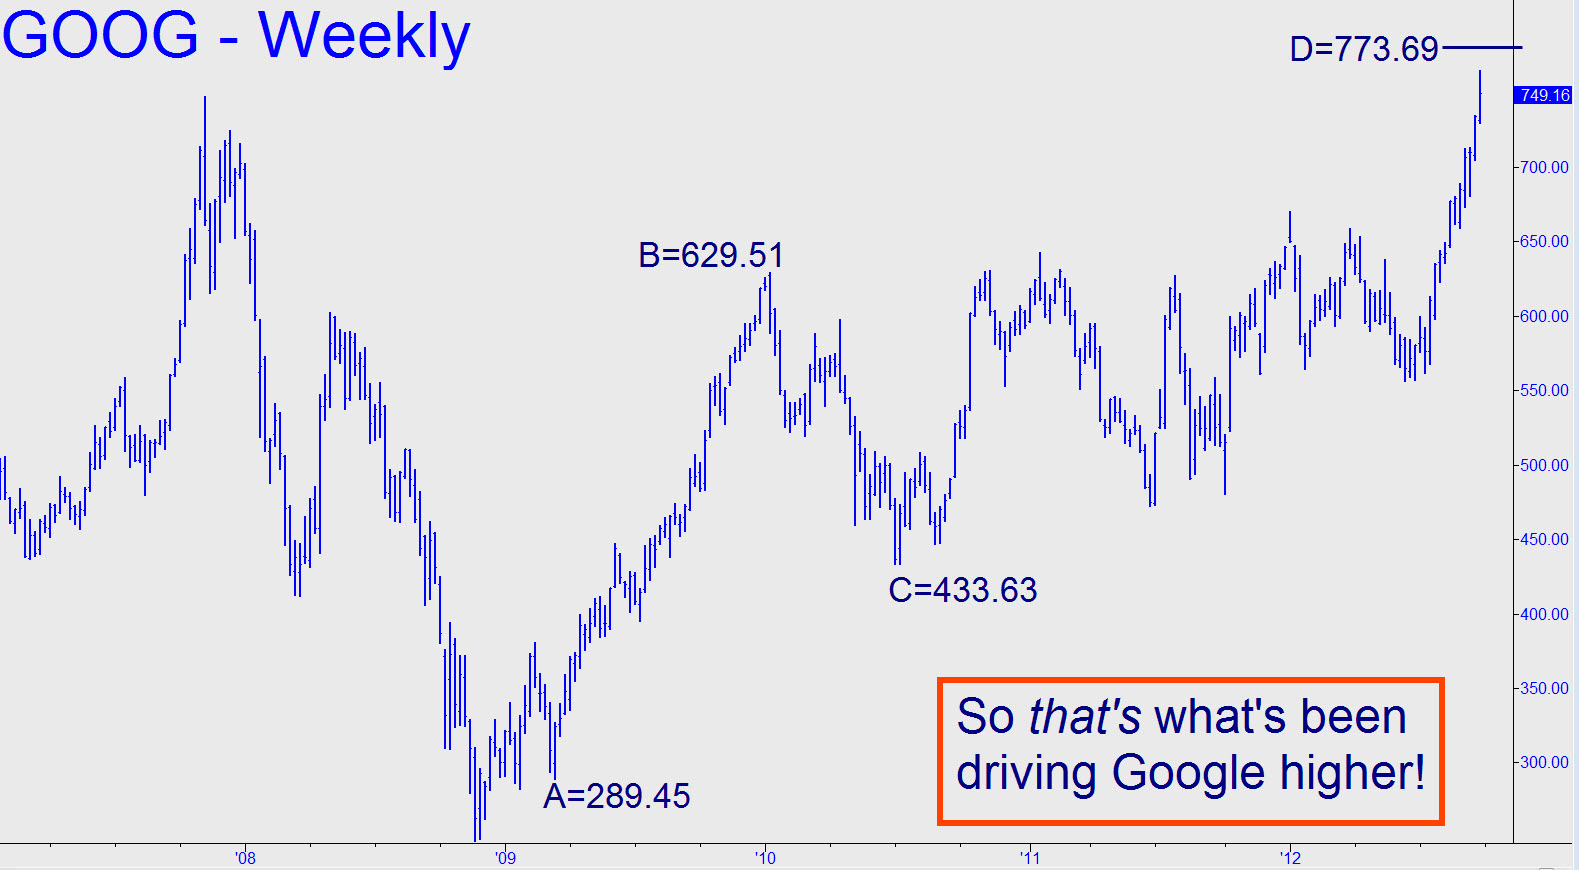
 The price action driving Google higher has been so powerful and relentless that I checked the weekly chart to see whether there might be something bigger pushing the stock than Hidden Pivot patterns discernible on the daily and intraday charts. Sure enough, there’s a cycle begun from 289.45 (using a one-off point ‘A’) that projects to 773.69, a tad above the 770.28 target of a lesser pattern noted here yesterday. What the foregoing implies is that not only will there be double stopping power just above $770, but that Google could be magnetically drawn to those number before it seriously corrects. The stock has been too wild for me to suggest a specific strategy in advance (and there is the chance that an important high was seen yesterday on a key reversal from 764.89). Even so, I am proffering these numbers nonetheless so that you can use them as aggressively as you dare.
