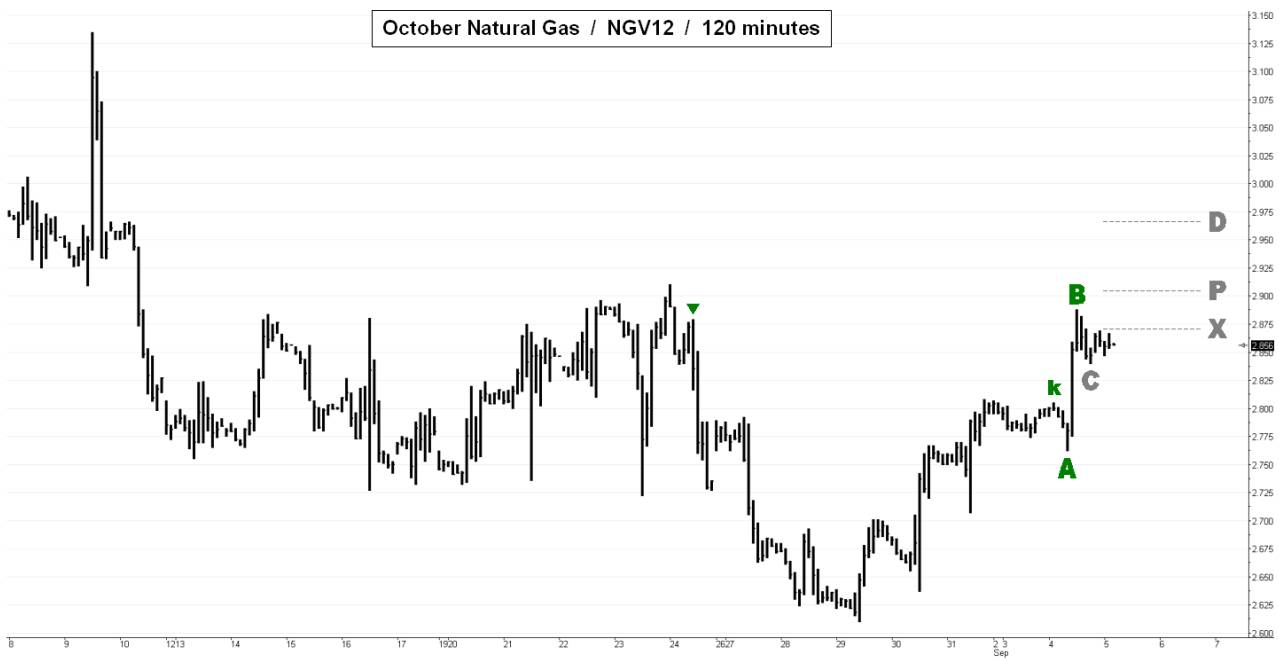
 Natural gas appears to have completed a significant pullback and is now aiming for a series of bullish targets ranging as high as 3.534. The large pattern in question began on June 14 and made its ‘C’ low a week ago. The midpoint of the pattern is at 3.072, a well-hidden pivot that might reward a short sale with a tight stop. Its ‘D’ sibling is all the way up at 3.534, which would be a high for the calendar year of 2012. In the meantime, we should watch the smaller, still-tentative pattern shown on the attached chart. The ‘C’ point is at 2.840, and that gives us an ‘X’ point of 2.872. Traders should be ready to recalculate in case the ‘C’ point is pushed somewhat lower. (Posted by Doug “harry” McLagan) _______ UPDATE (3:15 p.m. EDT): The ‘C’ point of our smaller pattern has been pushed down about as far as possible for the pattern to retain its value. Given that nat gas makes its big moves during the early pit trading hours (beginning at 9:00 a.m. Eastern time), it’s always a good idea to take a fresh look at the shorter-term patterns an hour or two before the pit opens. That said, if the 2.780 low holds, we might expect resistance overnight at 2.843, the midpoint of our pattern as it stands. The ‘X’ point is at 2.812.
