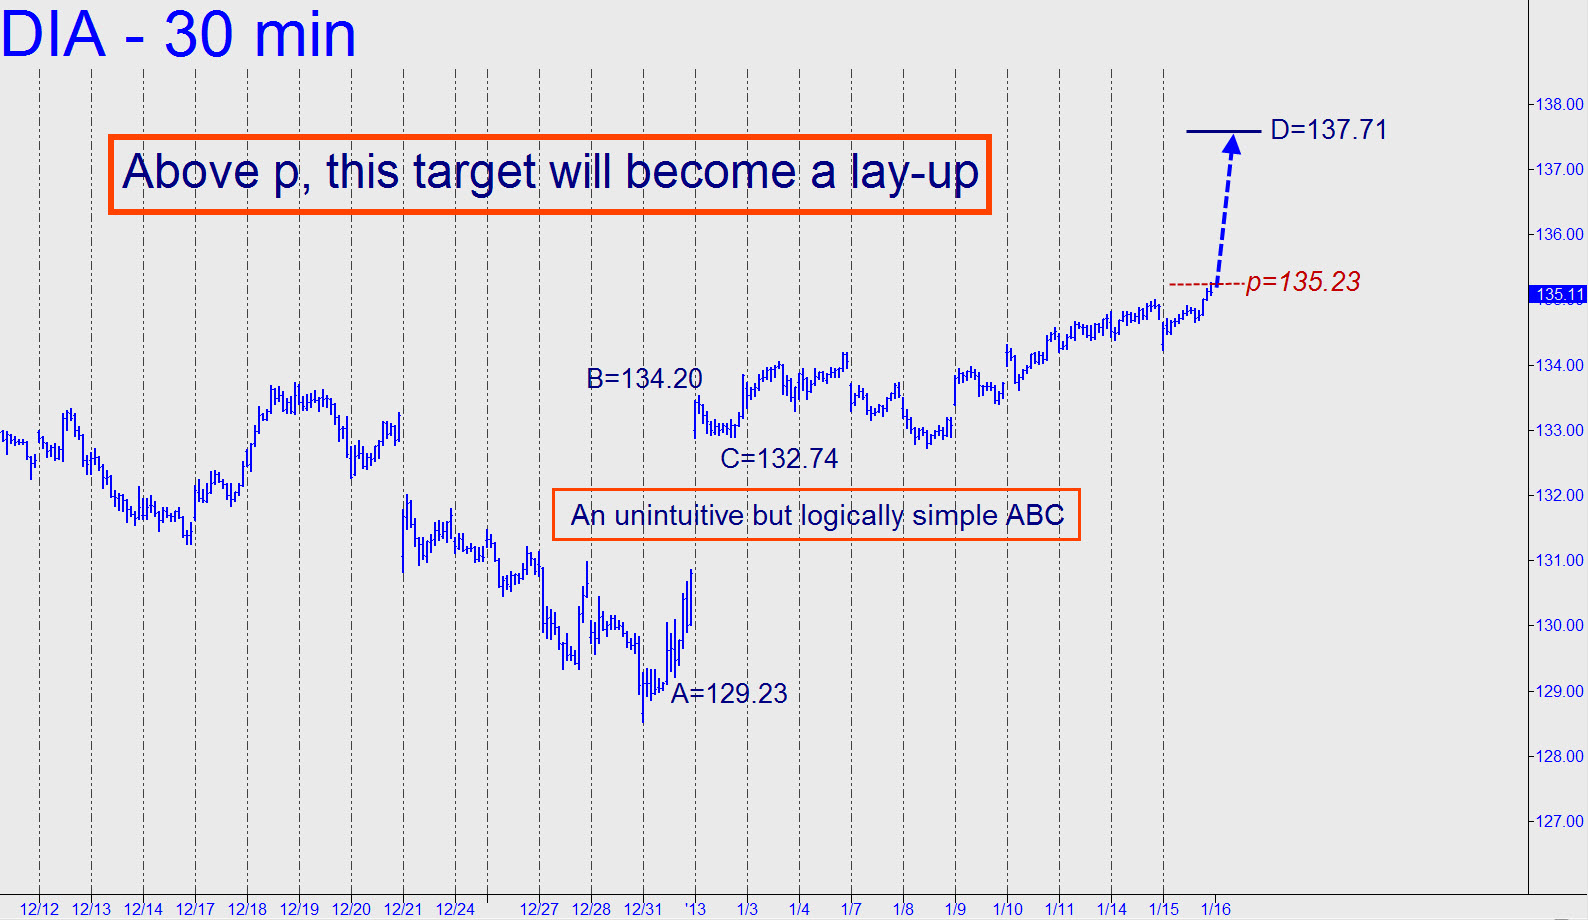
 You can see in the hourly chart (inset) just how far DIA is likely to fall if the dam gives way. Friday’s finishing stroke was bearishly impulsive to begin with, and so the 127.05 target of the pattern shown hardly seems out of line. The p midpoint at 129.02 has already been breached, but not by enough to make the plunge a done deal. _______ UPDATE (January 3 at 2:06 a.m. EST): A powerful reversal from well above 127.05 has put this vehicle on track to hit 134.89. This outcome would appear all but certain, judging from the way DIA gapped up through the 131.72 midpoint resistance of the pattern shown. The target can be used to get long now, or short soon, but camouflage will be tricky to find on the last leg up, given the runaway power of this move. _______ UPDATE (January 15 at 11:26 p.m. EST): Twelve days later, DIA did indeed hit 134.89. It actually topped 11 cents higher than that before DaSleazeballs pulled out the rug the next day with a gap-down print at 134.24 on the opening. This brazen shakeout was followed by a rip-roaring rally that began on the next bar. Now, I expect buyers to push this hot little mama to the 137.71 target of the pattern shown. Camouflageurs will need a deft touch to go with the flow.
