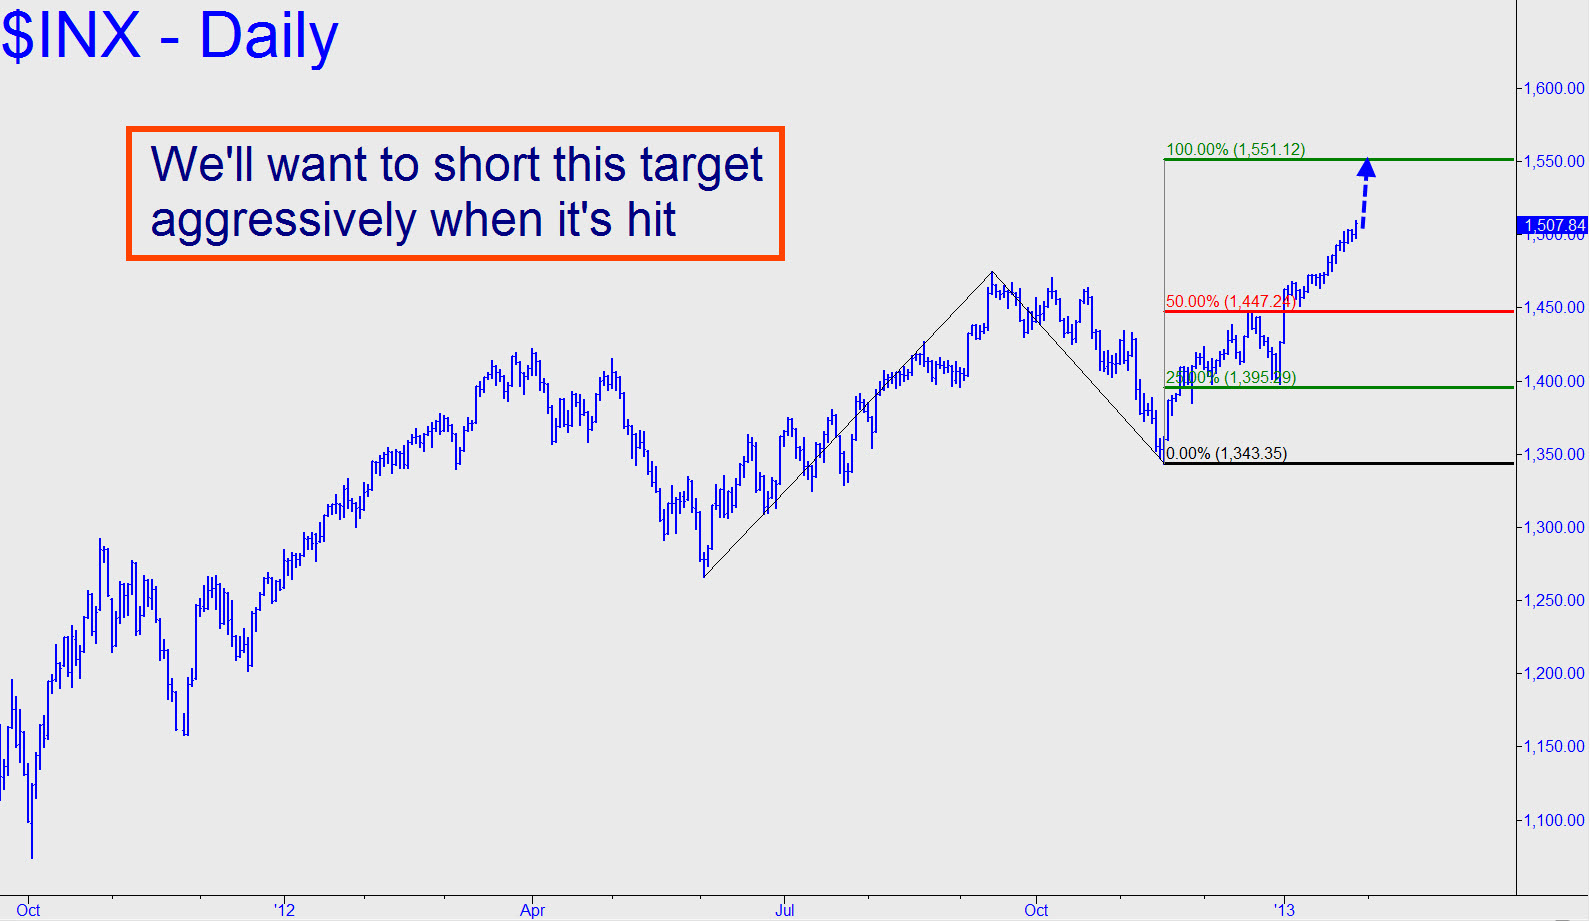
 A chat-room denizen posted a dandy SPX chart yesterday showing a target at 1502.76 that looked both precise and compelling. The index had yet to punch through the resistance, but it clearly was not backing off. In the end, buyers bulldozed their way higher, scoring their seemingly umpteenth gain in the last umpteen days. When such a beautiful Hidden Pivot gets schmeissed, as this one did, we should look to the larger charts to explain it. Notice in the daily chart reproduced alongside that there is yet one more rally target even more daunting than the one breached yesterday. It lies at exactly 1551.12, and you don’t need me to tell you we’ll want to short the bejeezus out of it when the S&Ps get there. Which they will. We’ll use a tight stop-loss even though it seems inconceivable to me that buyers will make much headway above the resistance, at least the first time it’s hit. We’ll do the actual trade using equity options, so check out today’s SPY tout for detailed instructions. _______ UPDATE (February 5, 10:26 p.m. EST): I’m going to retire this tout to an inside page for now, since the target is well above. You should set a price alert around 1545 nonetheless, since we’ll want to take advantage if bulls get close.
