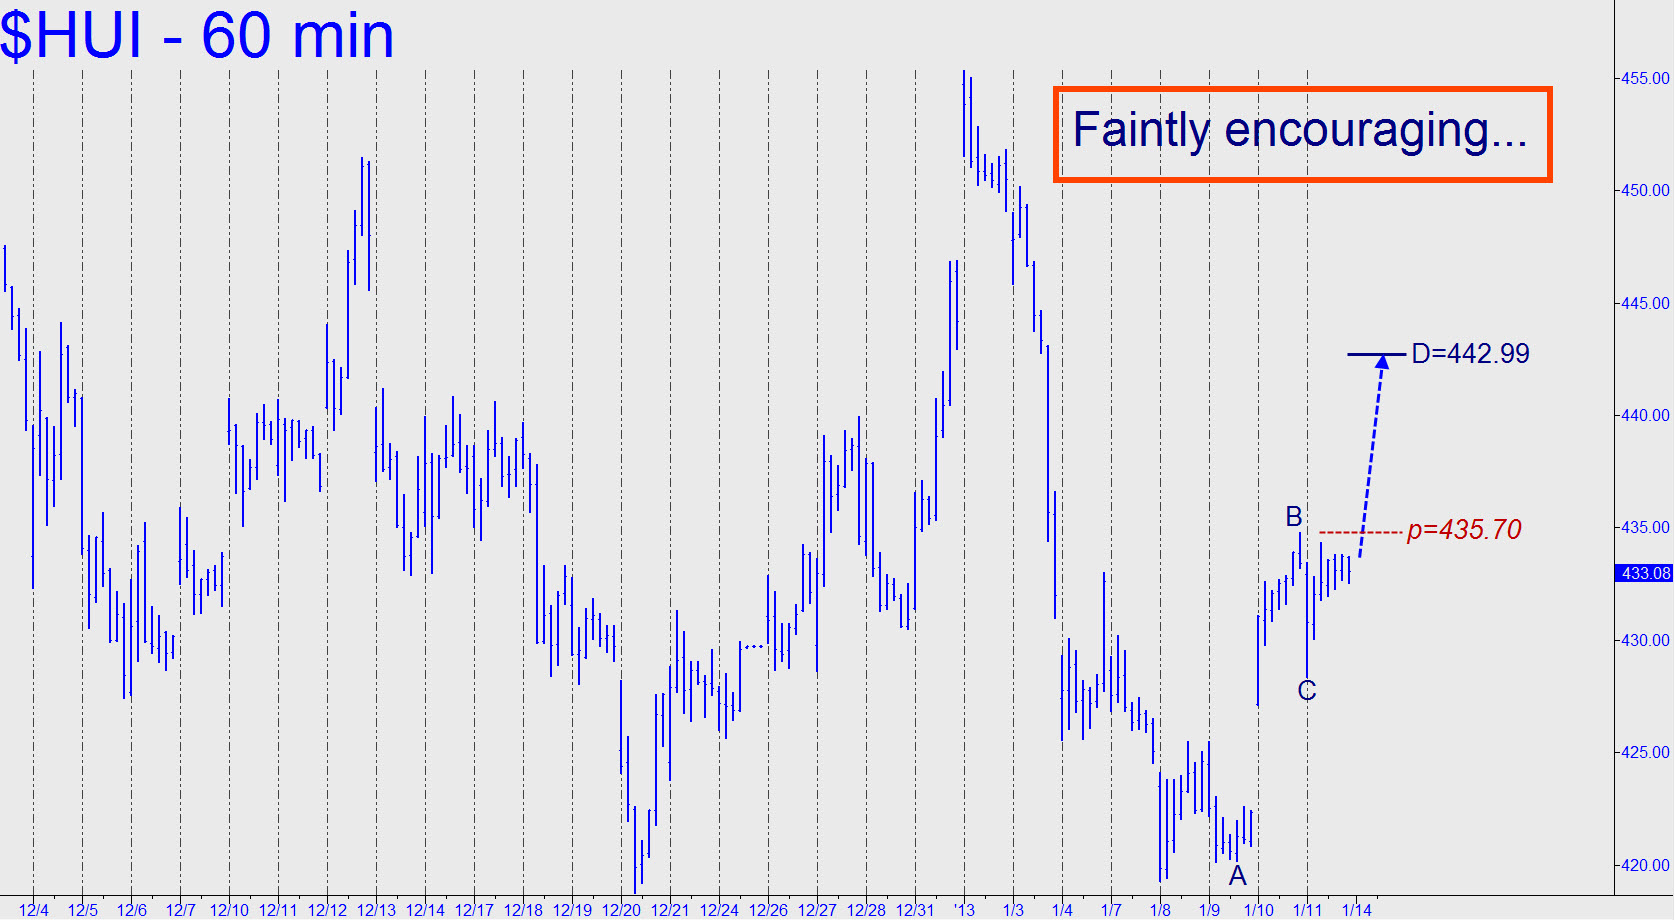
 The strong rally that unfolded over the summer was not impulsive on the weekly chart, and if you display it one the daily it becomes merely a “duel” between bulls and bears, with alternating impulse legs in either direction. What this implies is that we shouldn’t get too excited if HUI embarks on a sharp rally over a stretch of perhaps 3-4 days. Even so, we can treat the 491.04 p midpoint resistance of the pattern shown as real, and even look for a camouflage entry opportunity on the long side if it’s decisively penetrated. If you’re not that patient, it will still be possible to enter more or less at will, leveraging bullish impulse legs on charts of lesser degree well before the midpoint is reached. Since the entry signal at x has already been tripped, your trading bias should be bullish anyway. _______ UPDATE (January 13 at 1:22 a.m. EST): After a pre-Christmas, whoopee cushion bounce from around 420, this vehicle settled back into a rut. Now, however, it is bullishly impulsive on the hourly chart, with immediate potential to 442.99 (see inset). This target will become an odds-on bet if and when buyers push HUI past its sibling midpoint at 435.69.
