Bears Shouldn’t Despair

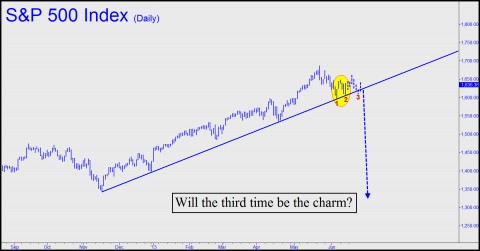
The chart below was posted in the chat room yesterday by a Rick’s Picks subscriber evidently at the point of despair over the stock market’s inability to muster a sell-off worthy of the name. The three-day downtrend reversed by yesterday’s swoon is a case in point.  This was the first time this year that the Dow average had fallen for three consecutive sessions. And yet, the drop from high to low was a mere 250 points — barely enough to placate beleaguered permabears, let alone satisfy them.  And although some of them may have experienced a little tingle Wednesday night when index futures were down the equivalent of an additional 250 Dow points, the exhilaration was short-lived, since DaBoyz engineered a low at around 2:30 a.m. Eastern that served as a launching pad for the ballistic rebound that was to hold sway for the next 14 hours. The Dow finished the day up 180 points — a roller coaster ride of 430 points.

While few would challenge the assertion that the stock market has become a sleazy midway game rigged for the benefit of a relative handful of shadowy, high-tech arse bandits, it is not the so-called algo-traders who are doing most of the manipulating. While it is indeed possible for these thimble-riggers to push stocks higher or lower via quote-stuffing and other strategies developed by digital trading’s netherworld (aka “dark pools”), the most significant rallies have come, as always, from old-fashioned short-covering. As we have pointed out here many times before, mere buying by bulls will never be powerful enough to push stocks through heavy supply to new record highs.  But short-covering is easily up to the task, since it is impelled by margin calls on traders who are getting eaten alive by every uptick. To set them stampeding, as has occurred a hundred times over the last few years, DaBoyz need only pull their bids overnight, letting stocks fall on nearly non-existent volume.  Then, the selling have been exhausted, as was the case at 2:30 a.m. Thursday, They simply await the inevitable mote of bullish news that will catch shorts with their pants down.  Such news is never long in coming, since anything besides an outbreak of nuclear war will always be regarded as bullish. And the worse the economic news the better, since it supposedly means that the Fed is less likely to do something it can no longer do anyway – i.e., tighten.

Buyers Tiring?

In the meantime, although we don’t want to give bears false hope, the trendline shown in the chart above merits watching. The fact that it has been touched twice in a little more than a week could be a sign that buyers are tiring. Were it to be touched a third time before a seemly interval (i.e., 3-4 weeks) has elapsed, we doubt that it will hold up. Our own, purely technical forecast calls for a 1600-point rally in the Dow. This seems so preposterous, however, that we continue to keep one foot on the fire escape, so to speak, as we trade the intermediate swings.  One thing seems nearly certain: When stocks finally break down there will be no opportunity to get short. That’s because the first hellish leg will occur on a gap-down opening following a short-squeeze spike erected the day before. If you’d like to see how we make playing this game of chicken less perilous – making it downright fun, even –  click here for a free trial subscription.

  • gary leibowitz June 16, 2013, 5:16 am

    When Rick sticks to his method, just observing the free advice, I would say he has made some impressive wins. I wish he wouldn’t look for gremlins all the time. He seems not to want to accept his own bullish forecasts by looking for any reason to bail out. The fear of getting caught in a dramatic drop that swallows you up is based on emotional baggage. His technical expertise will surely forewarn if the market is nearing a cliff, yet he refuses to acknowledge that his own strict rules will save him in time. The market so far is a text book correction off a very impressive run. It currently looks like we have more downside before a decidedly new thrust. We could have already seen the lows, but my gut says otherwise. I suspect the Fed’s comments next week will be the catalyst for the next move. Looking at institutional selling, it was high during this correction but seems to be tapering off.

    I stated 18 months ago that we should see the last leg up at a steep trajectory lasting no more than 2 months. His expectation for another 1600 point DOW move up jives with my macro view. Spooky that we are now in sync.

    Gold is definitely forming another wedge pattern that will break soon one way or the other.

    I don’t think there can be much animosity towards this post since I ignored politics, sex, and religion. I have decided not to post my entry and exit strategy since it falls on deaf ears. Just my outsider observation tells me that following Risk’s picks will keep you out of any major counter moves that can cause a big dent in your wallet.

  • Rich June 16, 2013, 3:23 am
    • gary leibowitz June 16, 2013, 5:34 am

      Hate to disagree but it looks like a few more days of treading water and its all down hill from there. Most commodities look like its ready to break down. Could be my bias since we are coming to a junction in most commodities that can go either way. Mid week should decide it.

  • Troll June 15, 2013, 2:36 am

    I think that big downward arrow on your chart is a little bit misleading if we are going to use trend lines as a means to analyze the markets technically. It implies we are going to the 1300 level when there is really nothing to validate it using HP’s, and we both know (along with those who took your course) trend lines rarely stand up to HP’s over the course of time. There is also nothing to justify that arrow using trend lines . . . and if we are going to use age-old technology like trend lines, we should also consider horizontal support. Would that be fair?

    http://oi39.tinypic.com/30aga2r.jpg

    On the weekly, we don’t even have a bearish pattern yet, but there are more than enough trend lines and more than enough horizontal support levels to hold the SPX up if we want to go there. Gold and silver should be so lucky if we are going to use lines as our method to properly diagnose the markets. I would infer (using lines) that gold is well on its way to $1000 per ounce and silver to $17.50.

    I am not saying drawing lines doesn’t work, I am saying they don’t work nearly as well as your own course and you shouldn’t use them as a means to placate despairing bears.

  • mario cavolo June 14, 2013, 4:38 pm

    Always enjoyable to continue reading the posts here. Meanwhile, someone tell me why the F%&K crude is back up to 98…? Unbelievable.

    Cheers all, Mario…e

    • Erin June 14, 2013, 5:22 pm

      I’ll take this one….QE is responsible…or in terms most regular people might understand…money printing is responsible! That is the whole damn problem with these parasitic bankers, they distort the prices of everything for their benefit while the real world pays the price….

      String them all up by their nuts and hang them upside down in a public place for all to see. These bankers are the enemy of the people!

    • John Jay June 14, 2013, 5:39 pm

      Mario,
      The Players can put the price of crude,( or anything) anywhere they want to give them the most profit.
      Who’s going to stop them?
      The Government?
      Sorry, the Government is busy working on plans to put a special levy on electric vehicles to make up for the deficit they cause in gasoline taxes!
      It is quite possible you might have to sell your electric car and go back to a gas burner to save money!
      Catch 22 once more!

      The Government is also working on plans for bringing in refugees from Syria over here.
      Probably not destined for California though, the vote here is already sewed up for our Overlords.
      So some other State will be punished for voting the wrong way.
      Crazy, crazy, crazy!

      Andy,
      I think you will be able to tell when interest rates on Government paper are getting out of control when you see real volatility in the 10 and 30 year futures market.
      I can remember wild trading days for ZB/ZN back in the day before the Fed would buy everything.
      As for now it all looks very well controlled by them.

    • Troll June 15, 2013, 1:34 am

      Oil is a diminishing resource. $98 is more than fair value, however, it’s not fair that we are paying pretty much the same price for fuel now as we were back in 2008 when oil peaked at $148 or so a barrel.

    • Cam Fitzgerald June 15, 2013, 12:10 pm

      Good question Mario. Crude looked like it made a double top mid May but then defied all the guys trying to make a buck going short and shot right back up to over 98. My instincts tell me though that when it reverses it will be taking gold down with it. Not long to wait to find out.

    • Dale June 15, 2013, 11:08 pm

      Mario.

      I enjoy reading your comments probably as much as you enjoy reading Rick’s commentaries and posting in this forum. And since you enjoy it, as you obviously do, why not take the next step and sign up for Rick’s webinar. You would benefit in several ways, not to mention the additional insight as to why his commentaries are (for the lack of a better word) biased in the direction they are. Also, you would not have to ask “why is crude back to $98”

      Using Rick’s Hidden Pivot method, look at the yearly chart and you will note a low on Apr 18th at $86.16. Price is not important here, only that it is a low with a preceding high. The next low ( a one-off we call it) is $90.32 on May 1st. The run-up to $97.38 was impulsive (meeting Rick’s criteria) and the pull back to $91.26 (also meeting Rick’s criteria) predicts a top at $98.32 Note that Crude got up to 98.25 on this past Friday which came within 7 cents (or 1% of the C:D leg). That is probaby close enough to warrant a pull back, (Rick’s HP’s will tell you how much of a pullback to expect) but a close above $98.50 will portend much higher prices.

      Cheers
      Dale

  • Andrew Gutterman June 14, 2013, 3:03 pm

    Quoting from the previous commentary:

    Rick wrote:

    “Higher rates would apply to a quadrillion dollar, leveraged derivatives edifice and all borrowing, public and private. Both are at civilizational highs. That is what the panic is all about.”

    What rate on the 10 year note would trigger such a panic? How high does it have to go before the leverage starts to unwind with catastrophic results?

    Does anyone know?

    Thanks,

    Andy

    • Jason S June 14, 2013, 5:13 pm

      Andrew,

      Maybe 2.5% JGB rates will be the domino to set the whole mountain of debt cascading. Those rates will cause their debt to exceed revenue and could be the weak link in the whole shadow banking realm.

  • John Jay June 14, 2013, 5:12 am

    There is nothing wrong with the US Economy that can’t be fixed by 100 year mortgages and 20 year car loans!
    And property taxes set at 10% of the assessed value will solve the revenue shortfall the bankrupt States face!

    Let Boxer from “Animal Farm” be your guide!
    “I will work harder.”
    “Napoleon is always right.”
    And so are Nancy, Johnny M and the rest of the crew!
    Good old fashioned “Horse Sense” at work!