
 I have mixed thoughts about what the stock market might do over the next 3-5 weeks, and in order to remain coldly objective, I’ll put the emphasis for now on technical indicators. First, however, and for the record, let me air my gut feeling that a rally to marginal new record highs will put a final top on the bull market begun exactly six years ago. The rally could start now or in late April, but probably not in-between, since Q1 earnings announcements coming in April could get nasty.
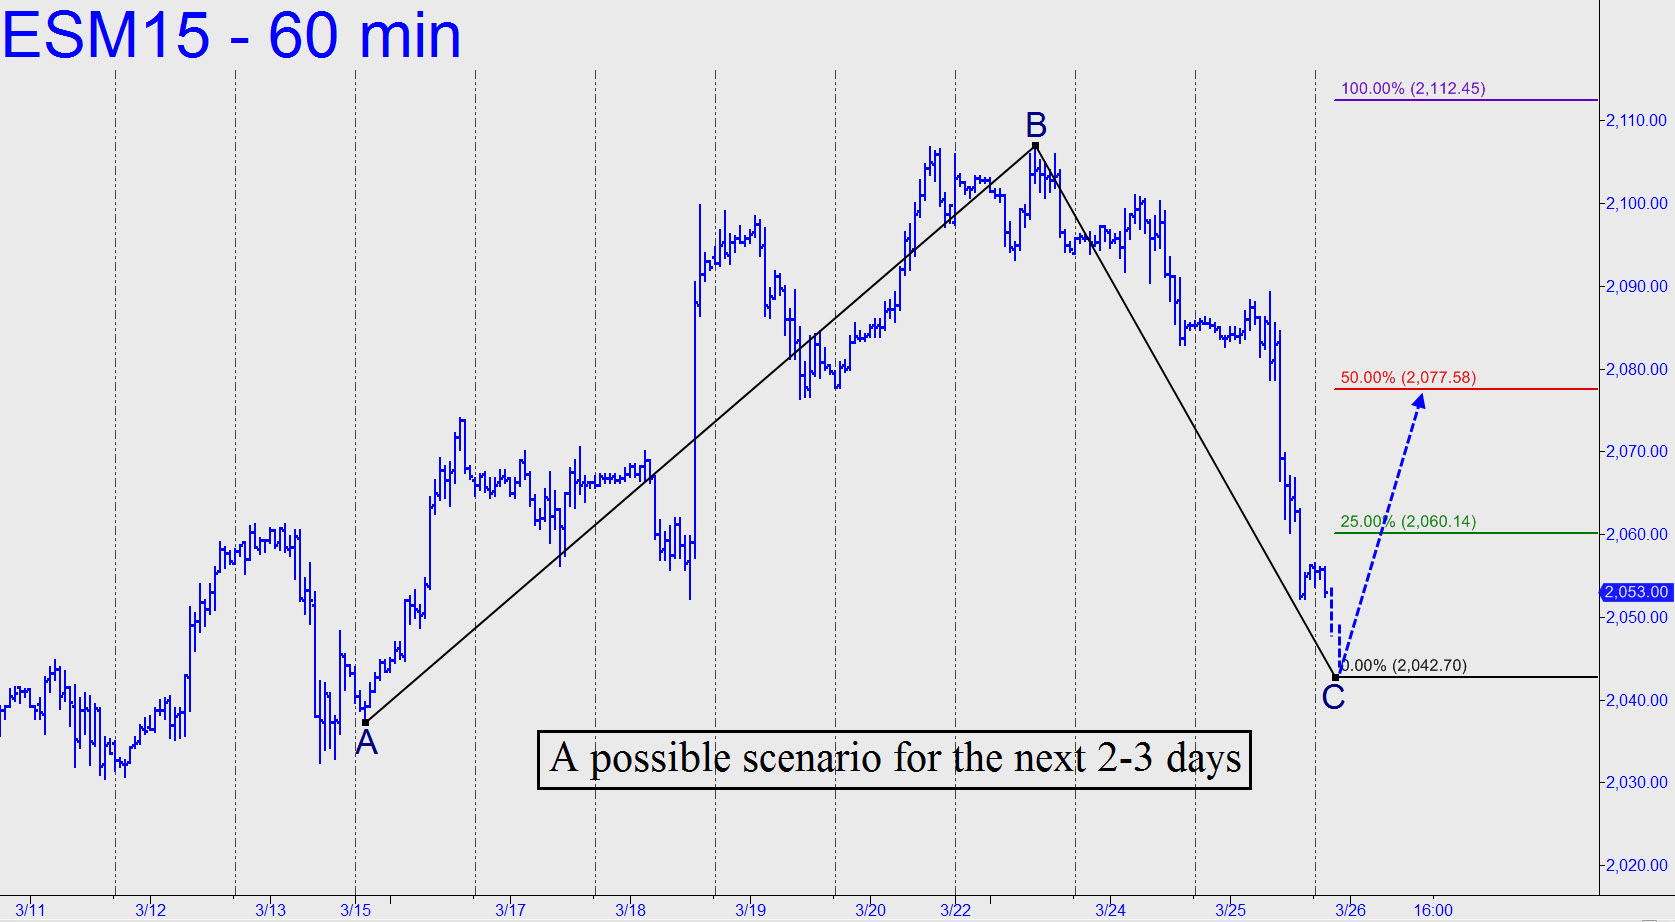
More immediately, the futures will have a chance to reverse yesterday’s sharp decline from 2042.75, a Hidden Pivot support associated with the steepest segments of Wednesday’s selloff (20-minute, A=2084.50 at 11:20 a.m.; B= 2060.25). As long as the bounce comes from above 2037.25, we can use the large pattern shown to project a target for the next rally. Alternatively, the selloff would wreak heavy technical damage on the daily chart if it continues over the next day or two, exceeding 2029.00 to the downside without an intervening rally lasting more than a day. _______ UPDATE (3:10 a.m. EDT): The markets have caught a whiff of fear from the Middle East, sending gold moderately higher and pushing this vehicle down to within 1.50 points of the 2042.75 target. The support is too fragile to take much punishment, and if it gives way we should brace for more slippage to 2019.25 (20-min, A= 2089.25 on 3/25 at 9:40 a.m.; B= 2052.25 on 3?25 at 4:20 p.m.; CC= 2056.25). A stall or bounce at the 2037.75 midpoint pivot would confirm that target.