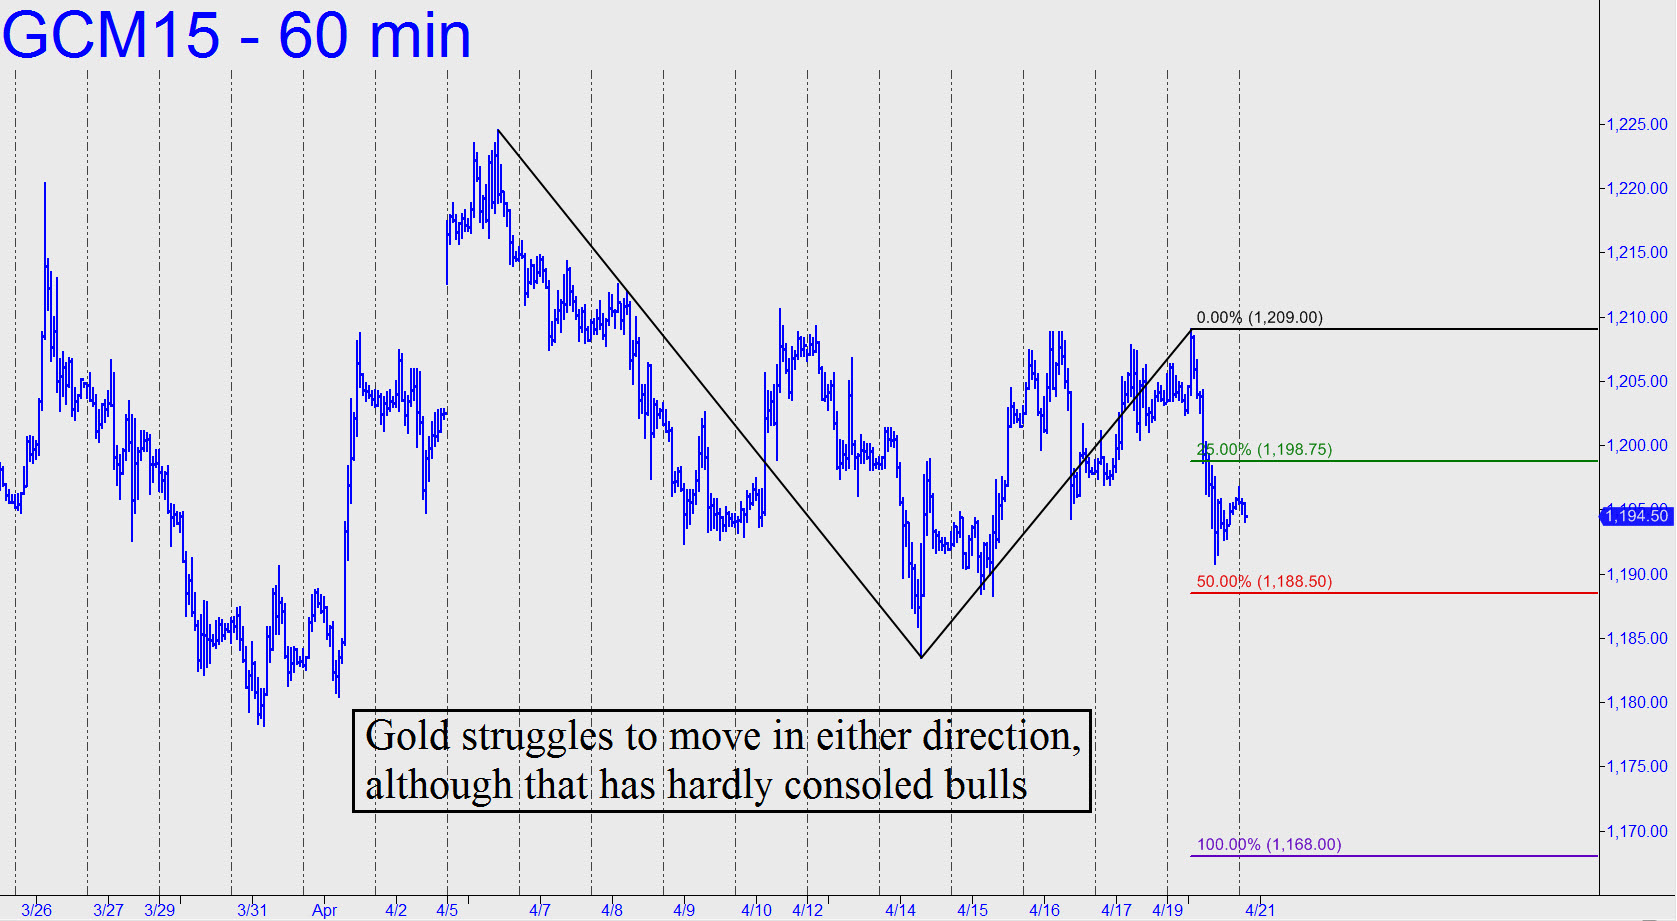
 Gold, now well into year four of a bear market, continued its familiar pattern on Monday: one step up, two steps back. My long-term correction target remains $810, although I’ll always keep an open mind about trading from the long side, or even initiating a long-term bet, whenever gold is merely creating bullish impulse legs on the hourly chart. For perspective, however, it would take a run-up to 1347, nearly 13% above these levels, to turn the weekly chart unambiguously bullish. More immediately, the June contract has come down to within inches of an 1188.50 midpoint support associated with a D target at 1168.00. If gold’s behavior in the days ahead is typical, however, bears will struggle to push it lower almost as hard as bulls struggle to keep it buoyant. Then, when it appears they’ve succeeded and are pushing for extra yards, the futures will turn higher, encouraging false hopes as they rise toward yet another middling rally target that will remain just out of reach. _______ UPDATE (April 21, 7:41 p.m. EDT): A moderate rally Tuesday morning pushed the futures to a minor target identified in the chat room in real time. The peak fell just shy of impulsiveness, but if this vehicle exceeds 1204.30 tonight by perhaps 0.10-0.40, then pulls back in b-c fashion, it could offer an entry opportunity for alert night owls. Check out the 15-minute chart to see the significance of 1204.30, an ‘external’ peak recorded Monday on the way down. _______ UPDATE (9:48 a.m.) 42 months into a bear market, gold rarely fails to disappoint. Overnight it exceeded the external peak noted above by a single tick. Then, instead of pulling back to ‘actualize’ this ostensibly bullish feat with a follow-through leg, it fell and kept going. There was one more failed rally overnight to a secondary high at 1203.50, but after that it was down, down, down to a so-far intraday low at 1195.10. The bad guys — i.e., gold bears — fared little better, since that low was inconsequentially above the previous day’s lows. It was also the precise, 1195.30 midpoint pivot of a pattern projecting to 1186.20 if and when the pivot is breached. On the 10-minute chart, here are the coordinates: A=1209.00 on 4/20; B=1190.80 on 4/20; and C= 1204.40 on 4/22.
