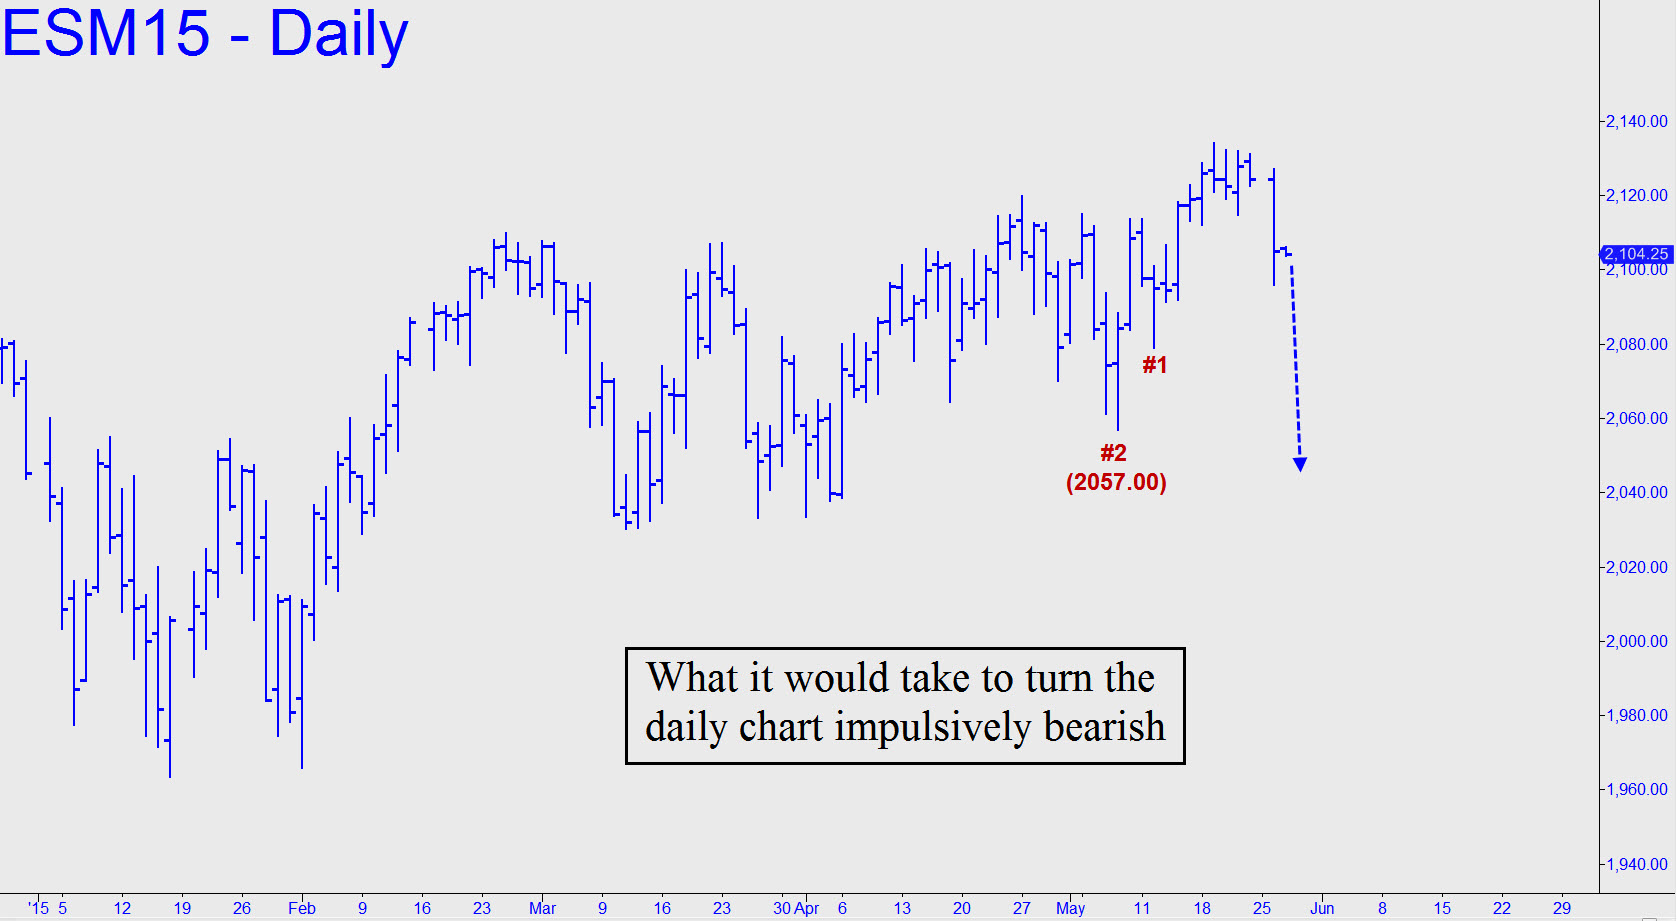
 We got done out of a promising short last week when the futures tiptoed to within four points of a 2138.00 target I’d drum-rolled. That happened on Tuesday, whereupon they noodled around near that price for the remainder of the week. Yesterday’s selloff put the target temporarily out of range, but it would probably be a less appealing short if it’s hit on a run-up from whatever lows impend. We’ll try nonetheless, since, as I noted here earlier, there are two Hidden Pivot resistance points near 2138, implying double stopping power. A further implication is that Tuesday’s plunge could conceivably be the start of a more significant decline. We’ll let the futures tell us rather than speculate. As the chart shows, the move would become bearishly impulsive on an unpaused drop beneath 2057.00. The hourly chart is another matter, having turned solidly bearish early in yesterday’s selloff.
