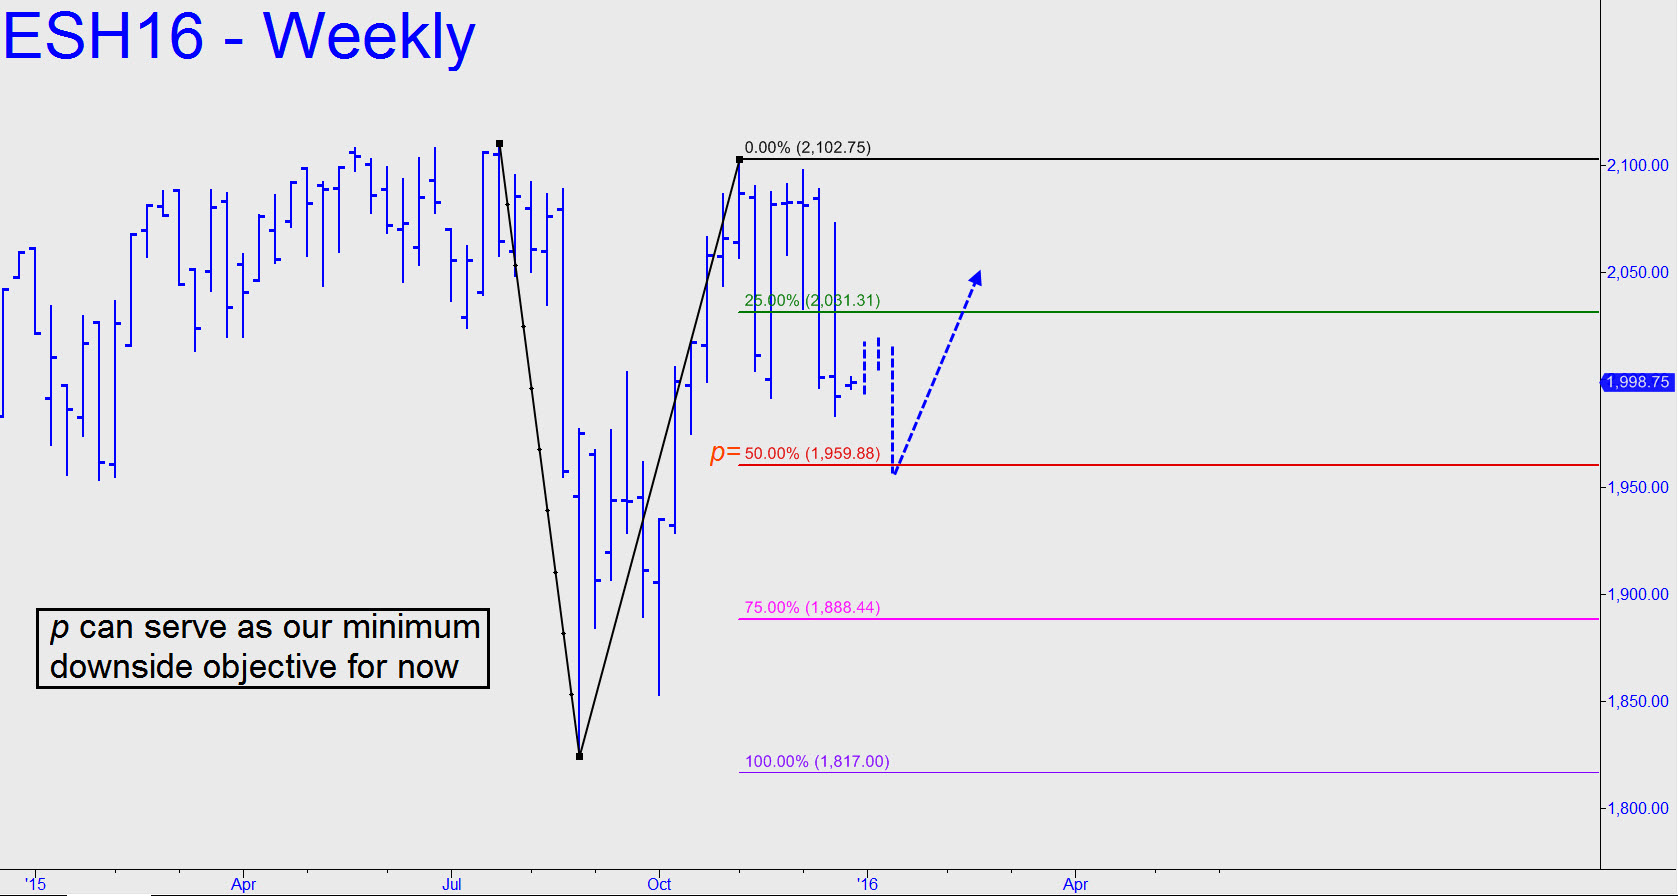
 The futures have opened Sunday night with a tentative bounce from Friday’s deeply oversold low. Because that low exceeded a 1994.75 target I’d flagged seven hours earlier by several points, we should be skeptical of any rally that fails to exceed at least two prior peaks on the hourly chart. That would imply a move of at least 32 points from these levels, surpassing Friday’s 2030.00 high. If and when the downtrend resumes, which is what I expect, we can use the 1959.88 midpoint pivot of the long-term pattern shown as a minimum downside target. That’s a nearly $2000 trade from current levels, but to cut the entry risk down to size we should look to do our shorting intraday, using a ‘mechanical’ signal from a chart of much smaller degree. _____UPDATE (9:02 a.m.): The futures have been up as much as 22 points ahead of the opening, but the rally so far is unimpressive, since it failed by 1.00 point to surpass an external peak at 2014.50 made Friday on the way down. The hourly chart is bullishly impulsive nonetheless, albeit weakly. Traders looking for a way in should use ‘camouflage’ based on this pattern on the 15-minute chart: a=1999.75 (3:15 a.m.); b=2013.75; and c=? (still undetermined).
