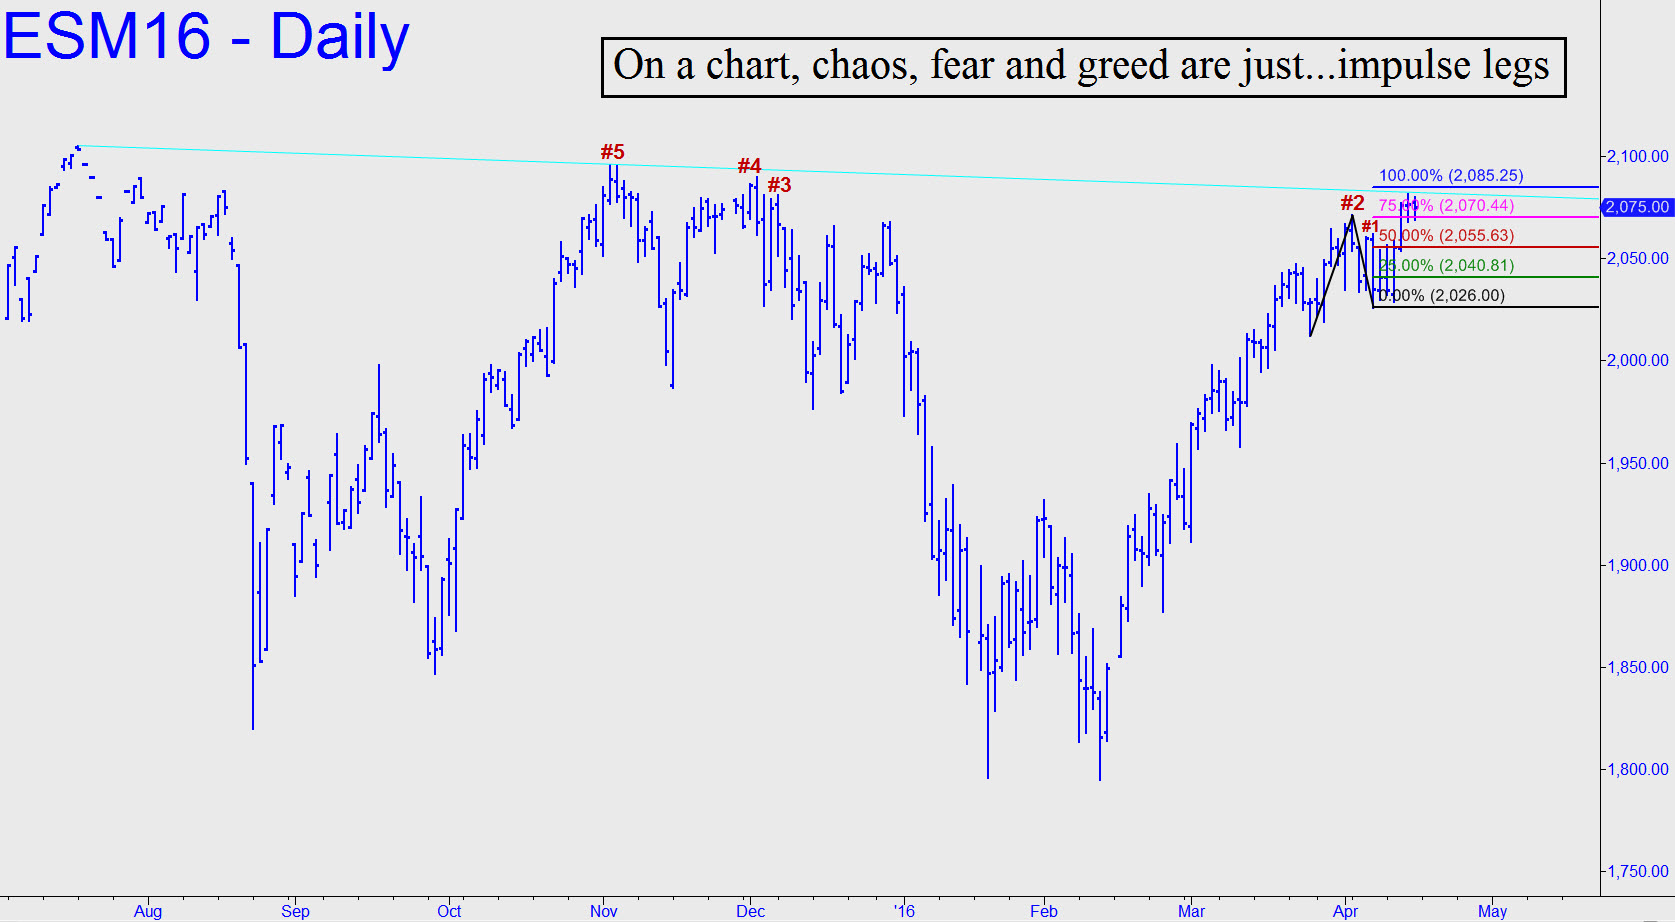
 Friday’s sloppy price action left intact a high from the previous day that precisely matched a long-term trendline. Still unachieved is a Hidden Pivot target at 2085.25 that lies a millimeter above the trendline. If the futures should break out to begin the week, the next spot where we might look for tradable resistance is at 2101.75, a Hidden Pivot of greater importance than the one at 2085.25. Although the nervousness of traders is likely to be at a fever pitch this week, my advice is to use the technical tools at our disposal to visualize price action in its simplest terms — i.e., as bullish or bearish impulse legs on charts of different time frames. That’s what we’ll be doing in the chat room, so if you’re looking for tradable ideas in real time, and for a way to reduce entry risk to a bare minimum, then by all means join us. _______ UPDATE (9:42 p.m. ET): Cartel talks to suppress oil output have very predictably failed, sending the E-Mini S&Ps 15 points lower on the opening Sunday night. Let’s get one thing out of the way now, so that we don’t have to waste time debating whether falling oil output can somehow overtake falling global demand with sufficient momentum to cause oil prices to rise. This idiotic notion is just the pipe dream of all who are praying desperately for a little inflation, presumably because it would help bail out a banking system hopelessly mired in bad energy loans. Sorry to be the bearer of bad news, guys, but any rally in crude is just a dead-cat bounce. As for the E-Mini S&Ps, we’ll pass up a ‘mechanical’ buying opportunity down at x=2040.81 (the green line) and simply observe. If the futures sink below C=2026.00 without having achieved the 2085.25 target, that would raise the odds that last week’s 2081.75 top will prove to have been an important one.
