
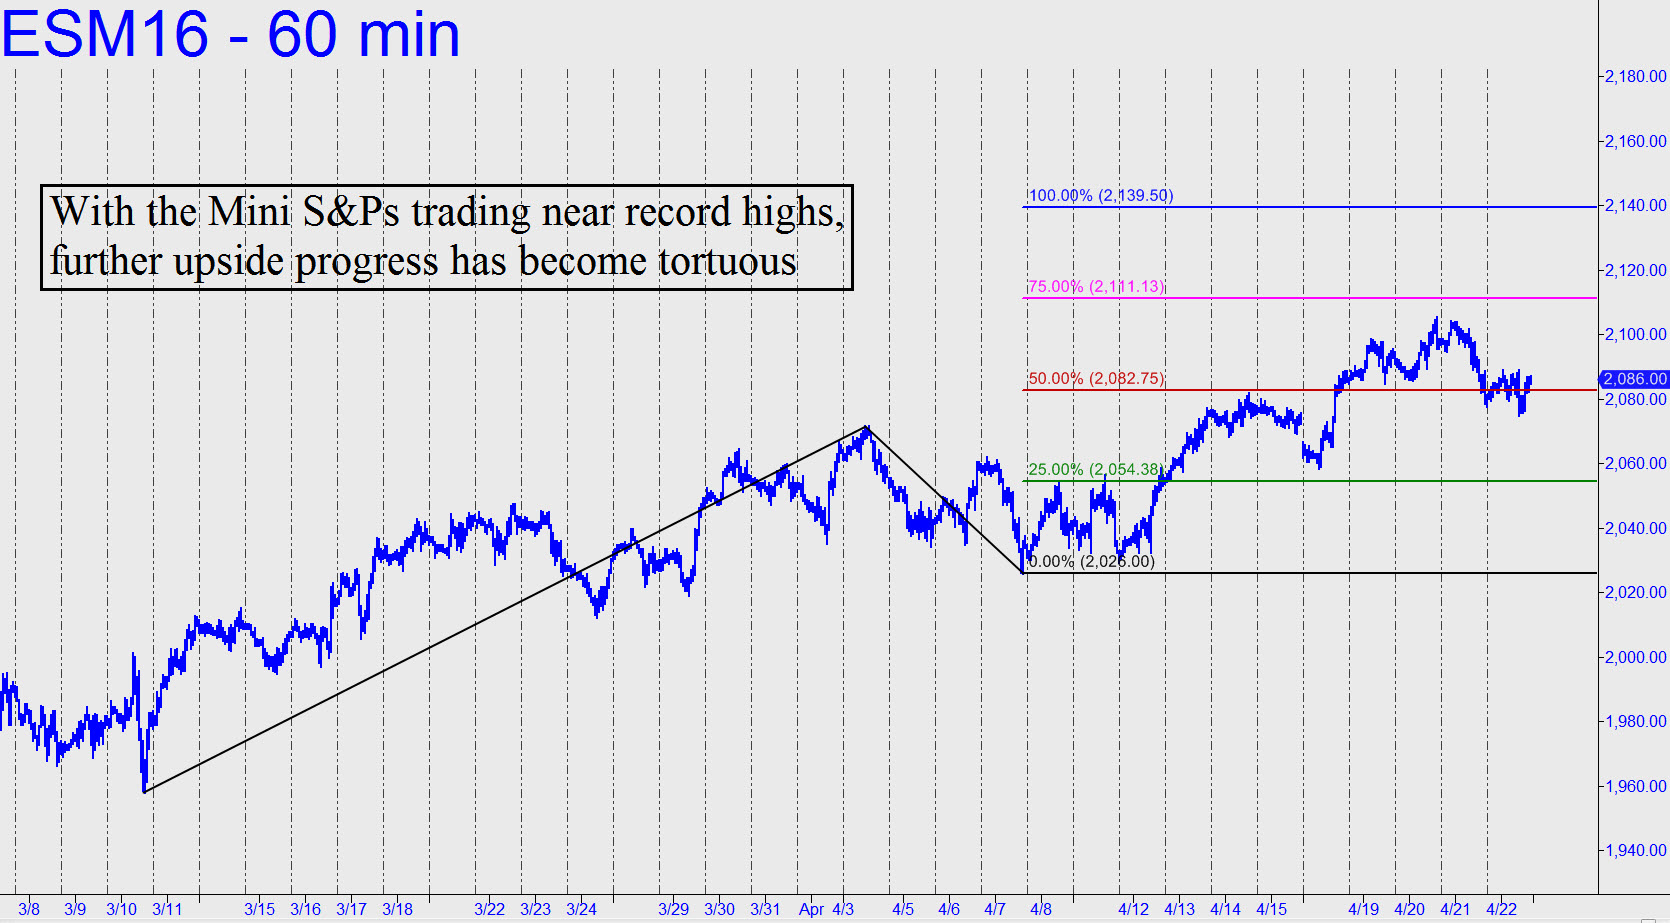
 I’ll wait till I hear from subscribers who got long ‘mechanically’ at p=2082.75 before I establish a tracking position. In the meantime, the futures were bogged down as last week ended, notwithstanding the fact that a long initiated at p was slightly profitable at the close. For now, if you got on board, use a stop-loss at 2074.75, just beneath Friday’s low. The heightened precaution is warranted for two reasons: 1) the futures failed to push decisively above p after the mechanical trade was triggered on Friday; and 2) last week’s highs occurred only slightly above a rally target at 2101.75 that we’d been using for several weeks. I am nevertheless offering a higher projection at 2139.50 for one reason: Thursday’s 2105.25 peak exceeded by a single tick the previous all-time high recorded last July. That effectively refreshed the bullish impulsiveness of the daily chart, making any pullback from here corrective and buy-able, at least in theory.
Obviously, I am at pains to give the all-clear for bulls, since the futures have been struggling lately for every inch of their gains. Under the circumstances, we shouldn’t try to forecast too far ahead. Stick with the intraday charts for now, and pay particularly attention to price action at midpoint pivots in both directions. To the degree they are exceeded, and assuming ‘duels’ do not develop, that should keep us apprised of the primary trend. _______ UPDATE (April 25, 11:27 p.m. ET): Rally targets at 2111.13 and thence 2139.50 still obtain, but price action has been too choppy for a buy-and-hold strategy. No subscribers reported using a ‘mechanical’ entry to get long as I’d suggested, but a buy at 2082.75 triggered on Thursday (or Friday) would have required a 2063.75 stop-loss and a 2139.50 target. Looking just ahead, a mechanical trade would be warranted in theory if the futures were to fall to x=2054.38, but the pattern that that would leave on the hourly chart looks too scary to me to attempt it. _______ UPDATE (April 26, 8:44 p.m.): Zzzzzzzz. No change in my guidance. _______ UPDATE (April 27, 6:50 p.m.): Still no change. Traders should use the bullish pattern on the hourly chart starting with A=2065.25 (4/18, 10:00 a.m.) to find useful targets and levels. It projects to D=2111.00.
_______ UPDATE (April 28, 5:21 a.m. ET): A discouraging word from Japan’s monetary alchemists has sent the futures sharply lower from a 2094.25 peak that fell well shy of our 2111.00 target. The downtrend projects to p2=2069.25 (60-min, a=2104.00 on 4/20), or perhaps to D=2061.00 if any lower. The selling would seem serious only if the 2061.00 “hidden” support is smashed — an outcome that I do not expect.