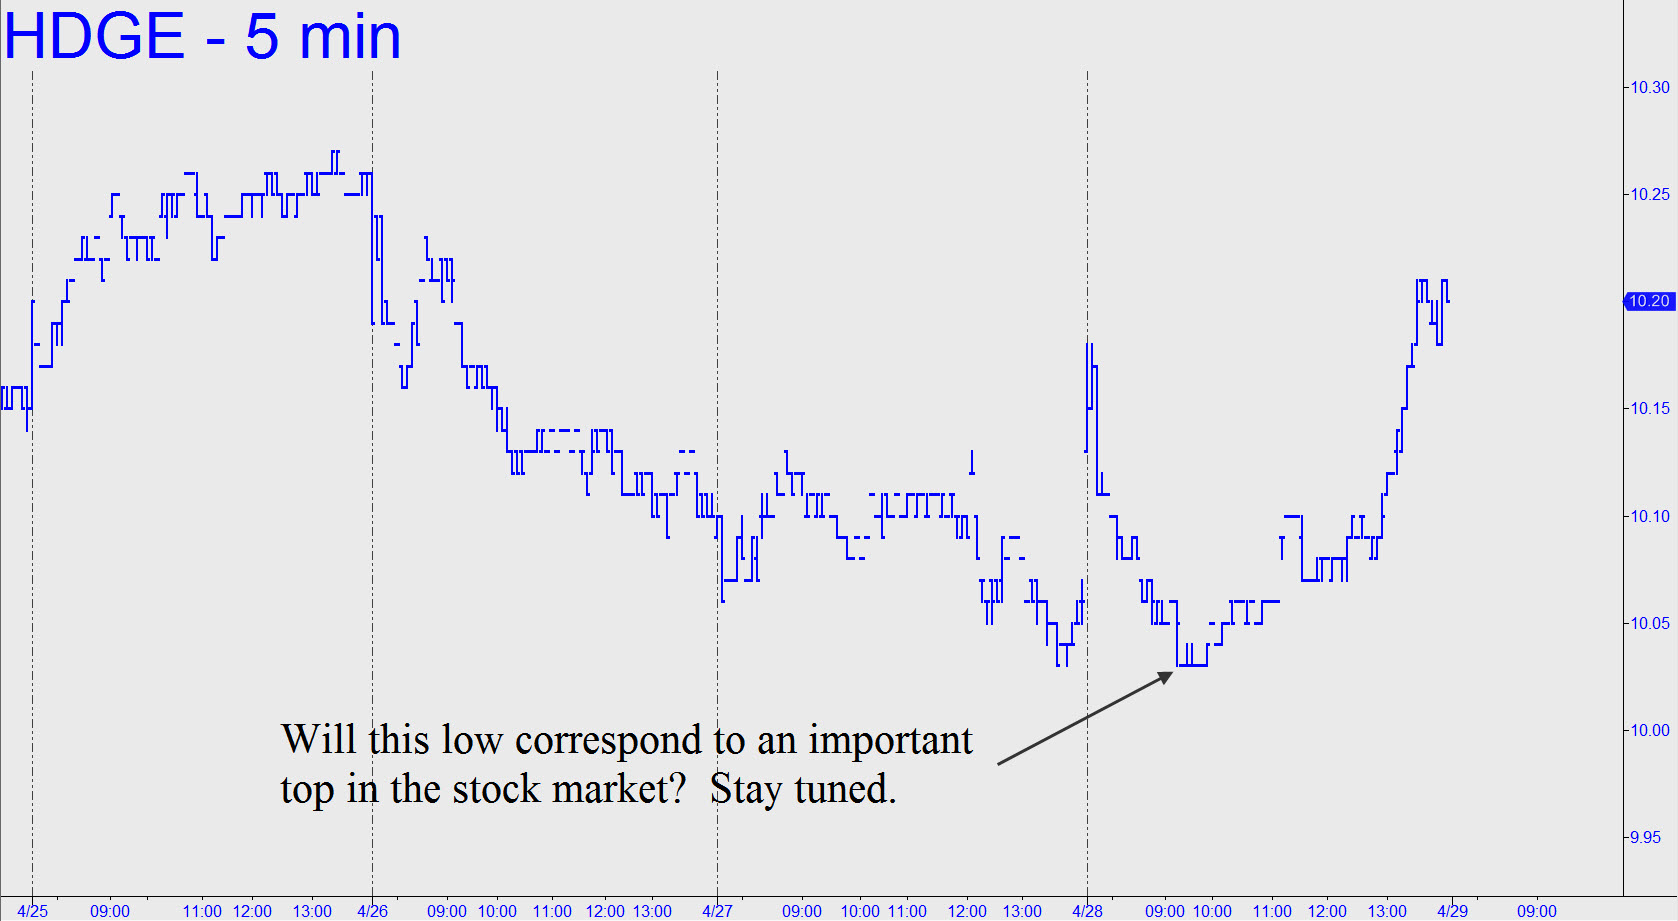
 Subscribers who adhered to my 9.99 stop-loss were able to ride out the chop, since this bear-trade vehicle took off yesterday after having gone no lower than 10.03. For your guidance, I’m tracking a 200-share position with a 10.15 cost basis. We’ll leave the stop in place for now, but be aware that I intend for you to hold the position for a long, long time. HDGE’s movement to the upside has typically been glacial, and even if the pace picks up we will need to have caught a very important market top to make money on this trade. I will augment the position if the opportunity to so so with little risk presents itself. We originally had a bid in at 10.06 for 400 more shares, but when it failed to fill I recommended canceling it. However, if I hear from at least four more subscribers who left the bid in and bought the stock when it relapsed this week, I’ll add 400 shares to the tracking position. _______ UPDATE (April 29, 12:05 p.m.): Many subscribers reported jumping on the 400-share trade, so I’m going to track a 600-share position with an average cost per share of 10.07. Today’s rally looks great but I will suggest nonetheless, as a I invariably do, that you take a partial profit on 200 shares now, at around 10.35. That will effectively reduce our cost basis to 10.00 — below the recent bottom at 10.03 — so that we can do no worse than break even. _______UPDATE (May 1, 4:58 p.m.): HDGE subsequently traded as high as 10.38, allowing traders to take a partial profit at 10.35 without difficulty. Our tracking position will reflect this, leaving us with 400 shares and a cost basis of 10.00. For the time being, do nothing further. Because Friday’s rally pushed past an ‘external’ peak at 10.37 recorded on April 19, it generated a bullish impulse leg on the intraday charts. This implies that any weakness in the days ahead should be regarded as a possible buying opportunity. _______ UPDATE (May 3, 9:48 p.m.): Today’s pullback to 10.42 provided a textbook opportunity to get long(er) ‘mechanically’. Check it out on the hourly chart if you’re interested in how these trades set up: A= 10.03 on 4/28; B= 10.38 on 4/29; C=10.24.
