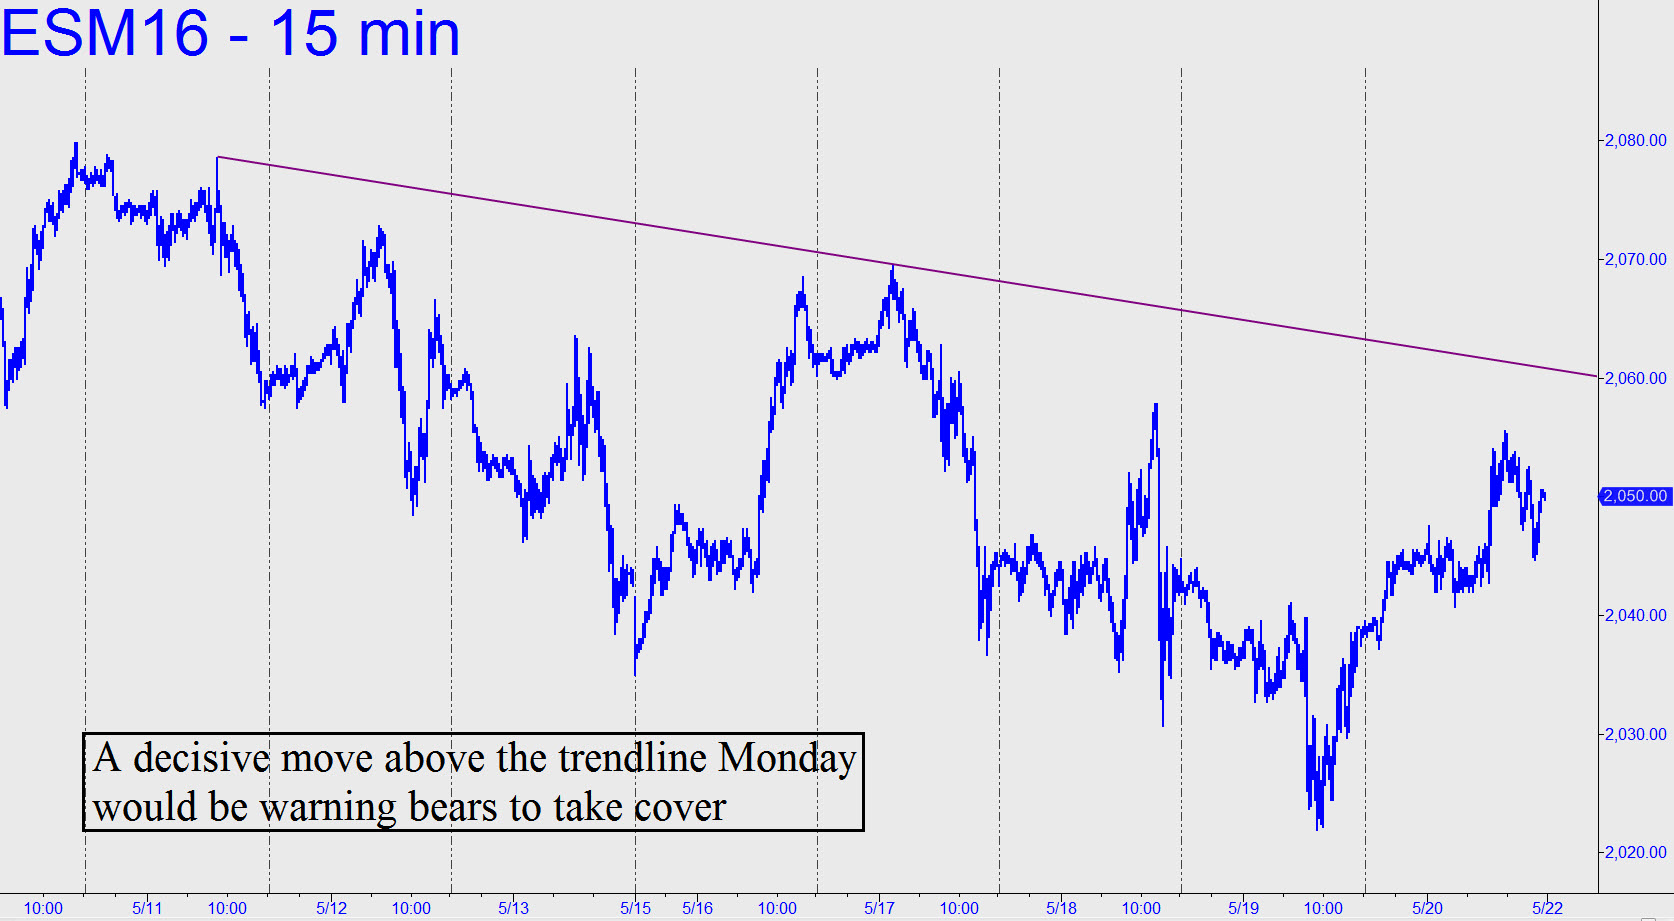
 We can dispense with Hidden Pivot targets for the moment, since the trendline in the chart (see inset) looks good enough to guide us. Looking just ahead, although the nasty short-squeeze off Thursday’s lows ran out of steam on Friday, look for it to get second wind for a thrust to the trendline. It will make itself felt at around 2059 if the futures get there by mid-day, and I’d be surprised if it gives way the first time it’s touched. If it does, however, take it as a sign that DaBoyz mean business and that they are fixing to torture bears for at least a few more days. _______ UPDATE (May 23, 7:08 p.m. EDT): Zzzzzzzz. The trendline noted above will be felt at around 2057.50 midday if this brick should somehow rally. If not and it falls, look for a precise test, potentially tradable, of the midpoint pivot, 2032.48. An easy breach of the support would imply more slippage over the near term to at least p2=2020.38, or, worst case, to D=2008.50. Use these coordinates on the 15-minute chart to recreate the pattern: A=2069.50 (5/17); B=2022.00 (5/19); and C=2056 (5/23). _______ UPDATE (May 24, 9:35 a.m.): The short-squeeze rally begun in the middle of the night stalled initially at 1258.00, which I would surmise is exactly where the trendline has come in at this hour of the day. At the moment, a second-wind thrust to 1259.25 has occurred. Let’s wait and see by how much the trendline is exceeded intraday; and whether the futures can close above it, which would be undeniably bullish.
