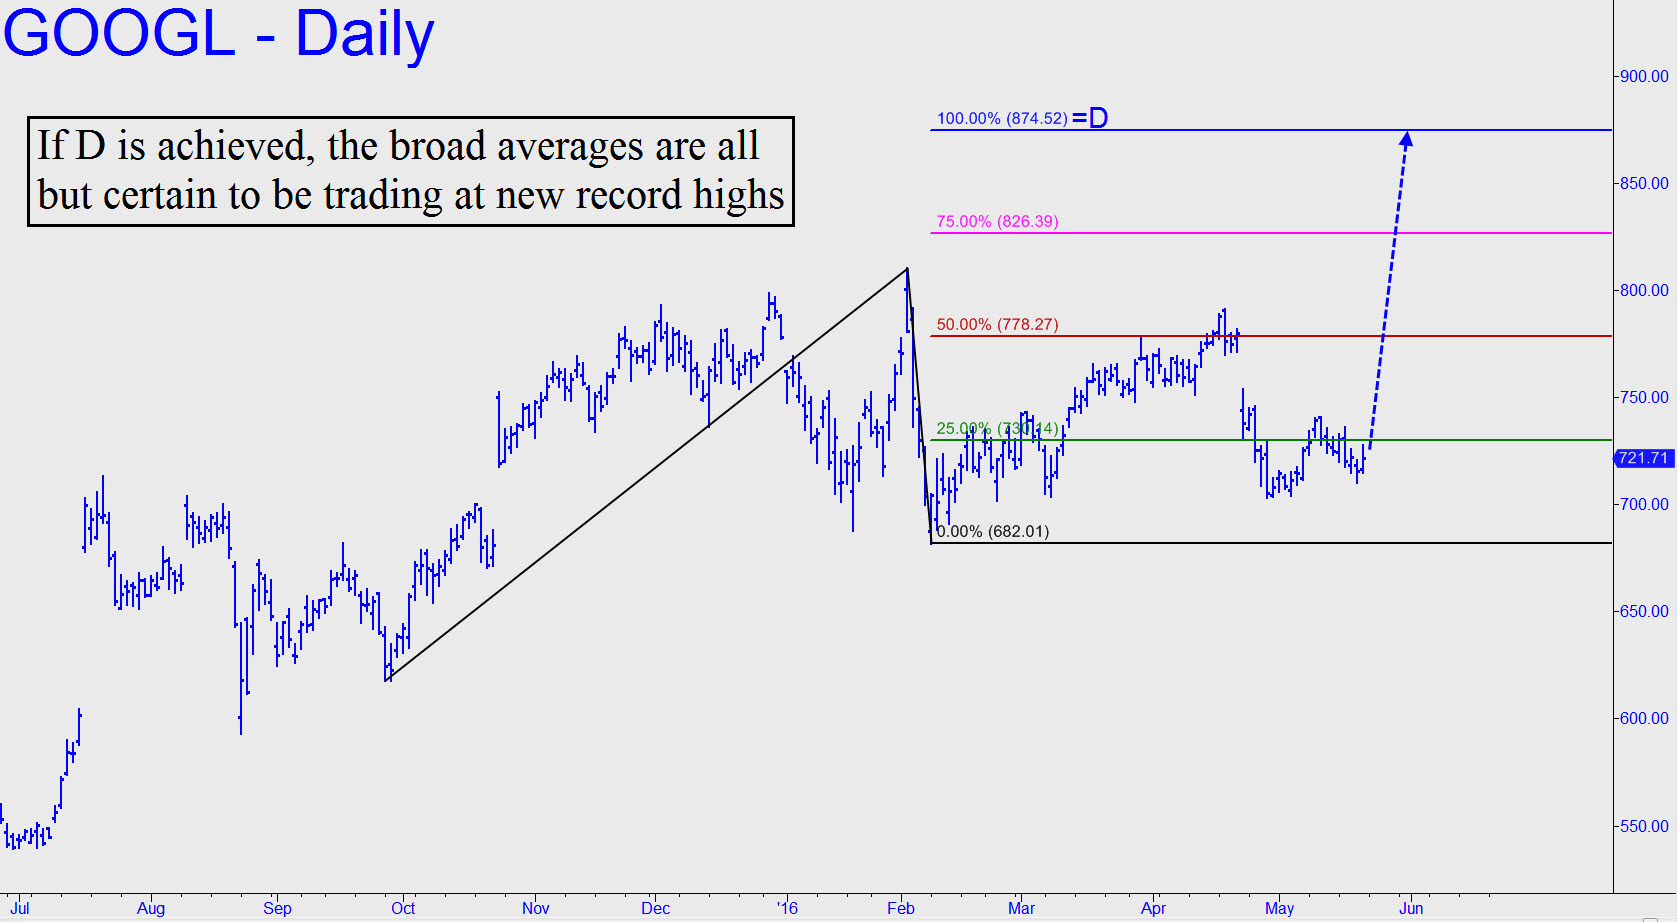
 The pullback to the green line was a ‘mechanical’ buy in theory, although we’ll forego the nearly $50 entry risk by using ‘camouflage’ to get long if the opportunity arises. Does the pattern look like it’s a good bet to hit D=874.52? I think so, and that’s why the mechanical bet looks somewhat appealing to me. One thing’s for certain: If the stock is actually on its way to the target, implying a 21% rally from here, the broad averages, most particularly the Nasdaq, are headed to new record highs. This is all speculative at this point, but it is reason nonetheless to monitor GOOGL’s minor corrective abcd patterns closely, since they can tell us whether the larger, bullish trend is about to resume. Most immediately, the stock ended the week on a minor bullish impulse leg with immediate upside potential to as high as 738.03 if 720.66 is not exceeded to the downside first. _______ UPDATE (May 23, 8:01 p.m. EDT): So much for the minor bullish impulse leg noted above. If the weakness continues, GOOGL will soon be groping for support at 701.56, the midpoint Hidden Pivot support of this pattern on the daily chart: A=781.68 (4/21); B=703.20. ________ UPDATE (May 24, 5:18 p.m.): A sharp rally has alleviated bulls’ worries for the moment, but the stock will still need to surpass April 26’s 745.59 peak before I could sound the all-clear.
