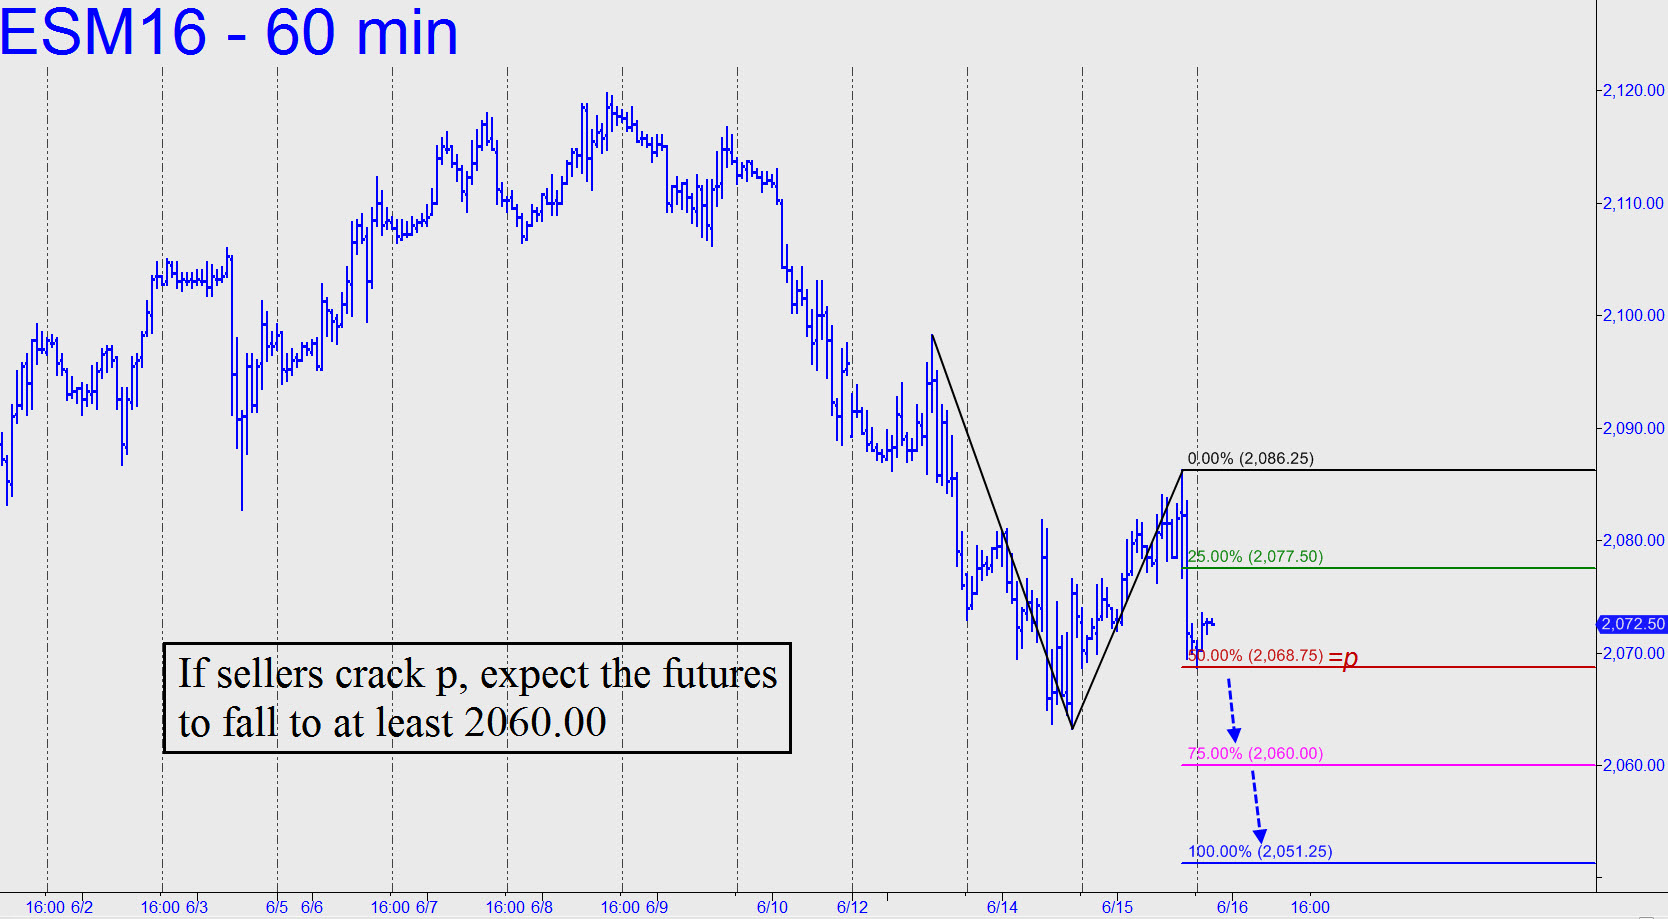
 With outstanding bullish targets well above these levels, I recently promised that I would keep a close eye on any technical developments that might threaten the rosy outlook. One such warning sign — one that I mentioned here yesterday — occurred on Monday when a minor corrective pattern exceeded its Hidden Pivot target (see inset). The pattern that produced it is sufficiently clear that there ‘should have’ been a tradable bounce. The fact that there was none has bearish implications for the near-term, at least, but we shouldn’t dismiss the possibility that it could mark the beginning of a far more serious decline. The next test will come at 2067.50, a Hidden Pivot support of slightly greater importance than the one breached on Monday. If it too gives way easily, take this as a sign that the selling is gaining in urgency and could start to snowball. The coordinates for the pattern, on the 120-minute chart, are as follows if you want to draw it yourself: a=2116.75 (6/9 at 4:00 p.m. EDT); b=2086.26; and c=2098.25. The equivalent target, basis the September futures, is 2058.50. _______ UPDATE (June 14, 7:39 p.m. EDT): Both contracts overshot their respective correction targets by a few points, implying that more weakness is coming. The decline would start to look serious if it were to breach 2012.25 (basis June) or 2004.50 (basis September). Both of those numbers represent important ‘external’ lows recorded on March 24. Alternatively, an upthrust touching 2082.00 (June) or 2073.00 (September) would suggest bulls are sufficiently rested and re-energized to halt the so-far four-day decline. _______ UPDATE (June 15, 9:09 p.m): If the futures trash the 2068.75 midpoint Hidden Pivot support shown, expect them to fall to exactly 2060.00, where we might look for a tradable bounce. If they go any lower, D=2051.25 would be in play. Alternatively, it would take an upthrust exceeding Monday’s 2098.25 peak to suggest bulls are turning things around.
