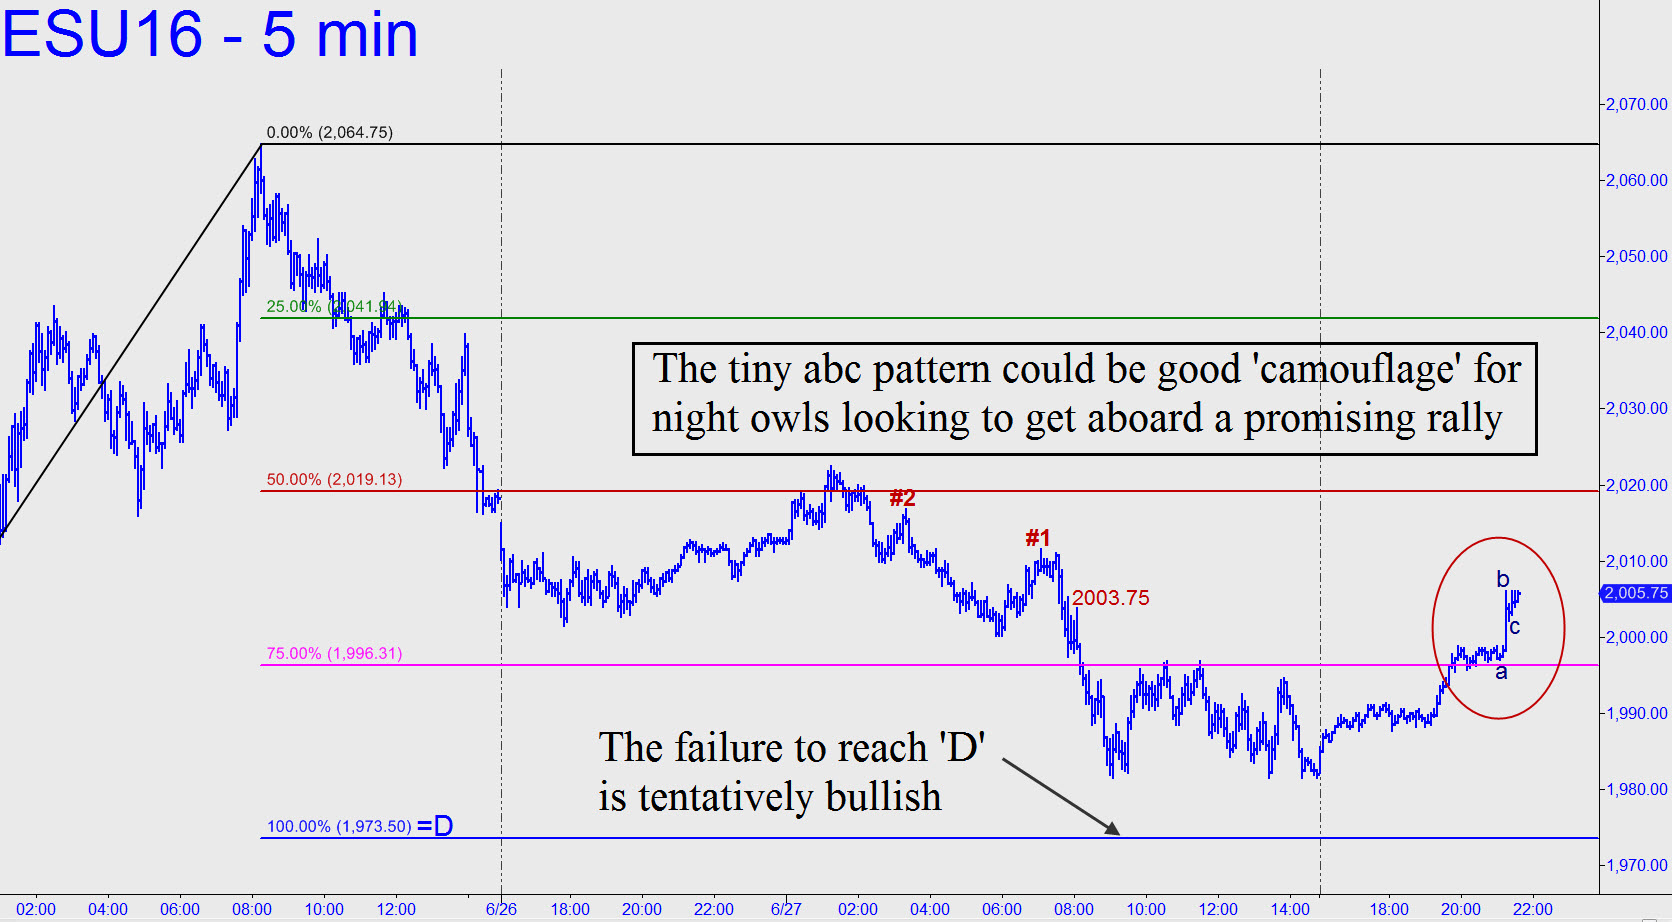
 The futures have turned upward Monday night for who-knows-what-reason, and the fact that they’ve done so without having quite reached a clear correction target at 1973.50 is promisingly bullish. It would be even more bullish if the rally now goes on to exceed the two labeled ‘external’ peaks, the higher of which lies at 2016.75. Night owls should take note of the tiny look-to-the-left peak at 2003.75, since it has already provided a handhold for a potential ‘camouflage’ entry created from the very small abc pattern at the right-hand edge of the chart. (Note: The point ‘c’ low of this pattern does not show up on the 5-minute chart, but it’s there — and potentially quite usable — on charts of lesser degree.)
