
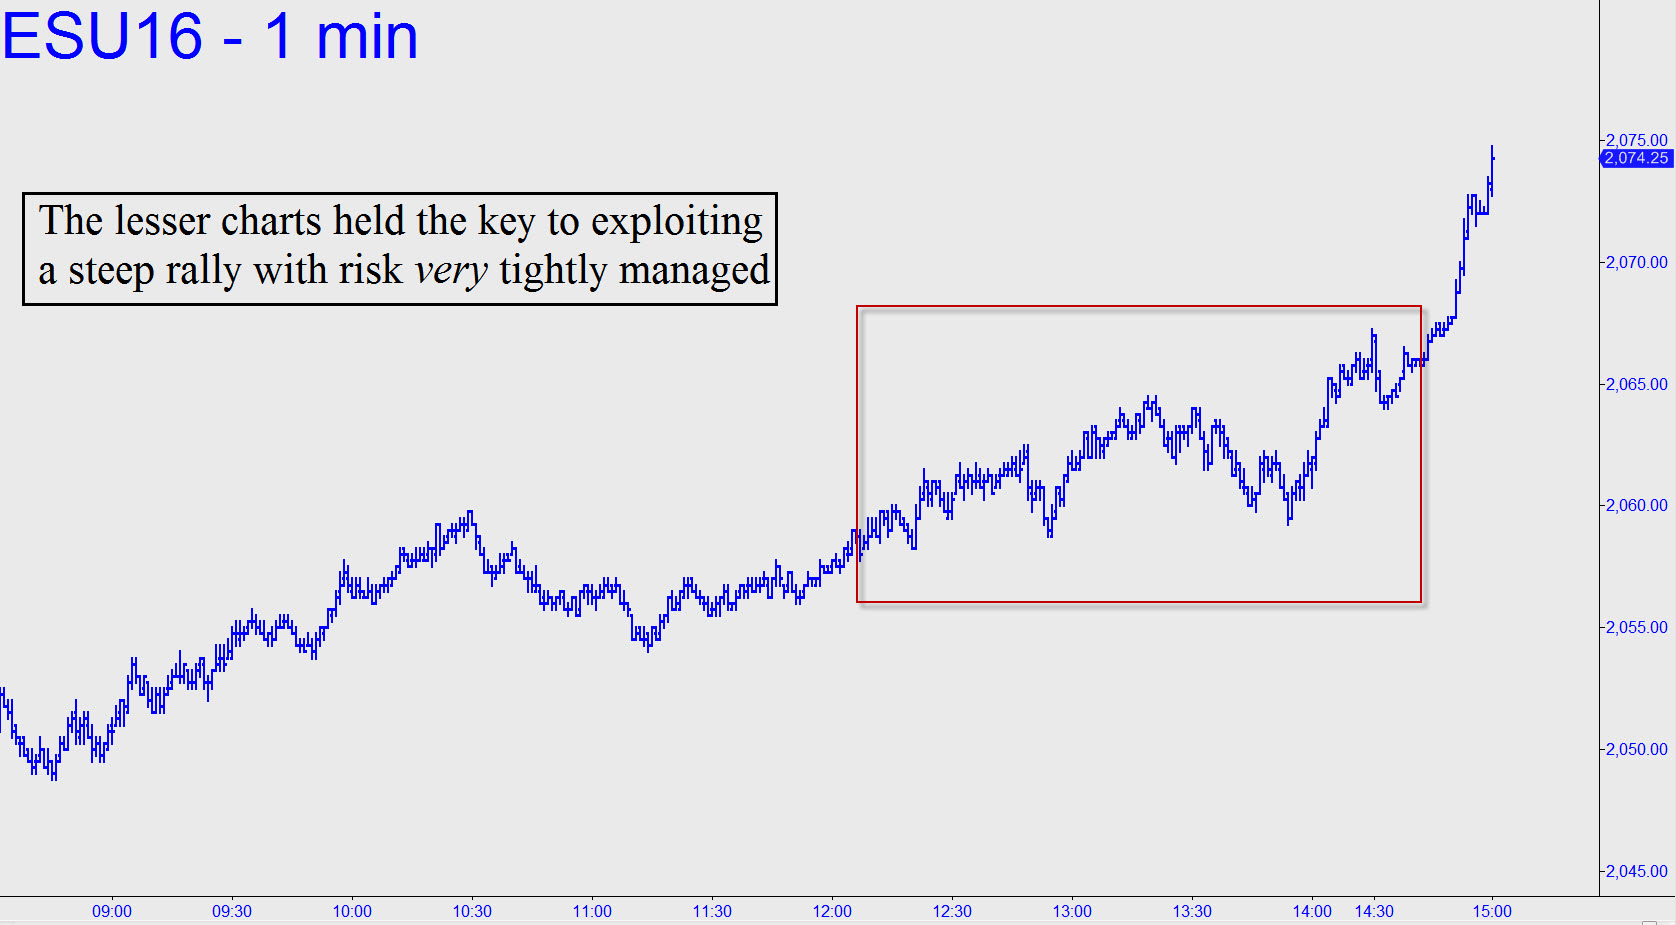
 Here’s a homework assignment for those of you who took the Hidden Pivot Course Tuesday night: Call up a one-minute chart of the E-Mini S&Ps, then compare price action to my posts in the chat room on Wednesday beginning at 15:27. It is at that time that I initially expressed skepticism about getting short just beneath a key peak at 2064.75 created on the bounce from the low of the Brexit selloff last week. I did so anyway, using a camouflage pattern; covered it minutes later near an important low; then reversed the position and went long for the so-far 14-point rally that has ensued. This went against a chat-room consensus that seemed, in my estimation, too eager to get short in too obvious a place.
My reasoning behind each step is minutely detailed in the chat room posts, so you’ll be able to deconstruct the trade in order to learn from it. I have often made the claim that the Hidden Pivot Method is well suited to jumping into a trade when fear, greed and uncertainty are at a crescendo, as was certainly the case here; and to do so with risk very tightly controlled. Take the time to retrace my steps and you will understand why this is so. The initial theoretical risk on the trade was just 1.00 point, but it put us in good position to exploit nearly 20 points of ostensibly wild, inscrutable price swings thereupon.