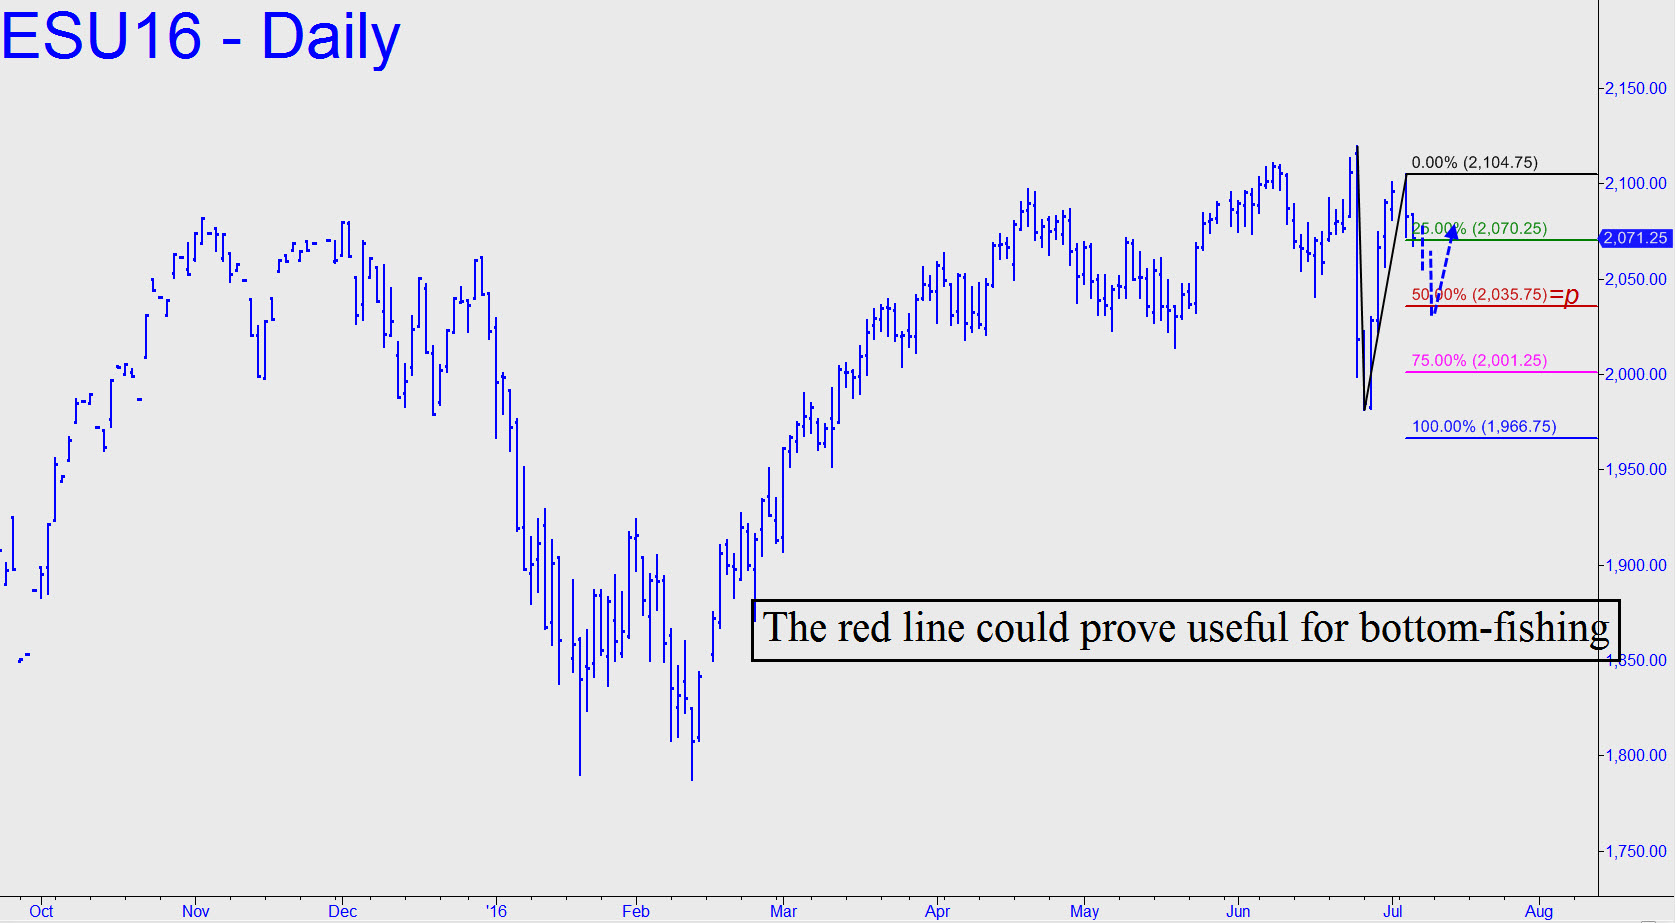
 If the futures ease lower for the next couple of days, look for a potentially tradable bounce from the red line, a Hidden Pivot midpoint support at 2035.75. It could be bottom-fished with a stop-loss as tight as 1.00 point. The pattern lacks a proper ‘one-off’ ‘A’, but everything else about it looks enticing enough for a try. The futures will likely need a running start from lower levels to take on June 24’s record peak, implying that a moderate rally at the opening on Wednesday be viewed as a bull trap and therefore a possible shorting opportunity. If this set-up takes shape, it would be best to exploit it using a downtrending ‘camouflage’ pattern on the 3-minute chart or less. With somewhat less work, you might also be able to get short at the midpoint pivot or ‘d’ rally target of a minor abc uptrend.
