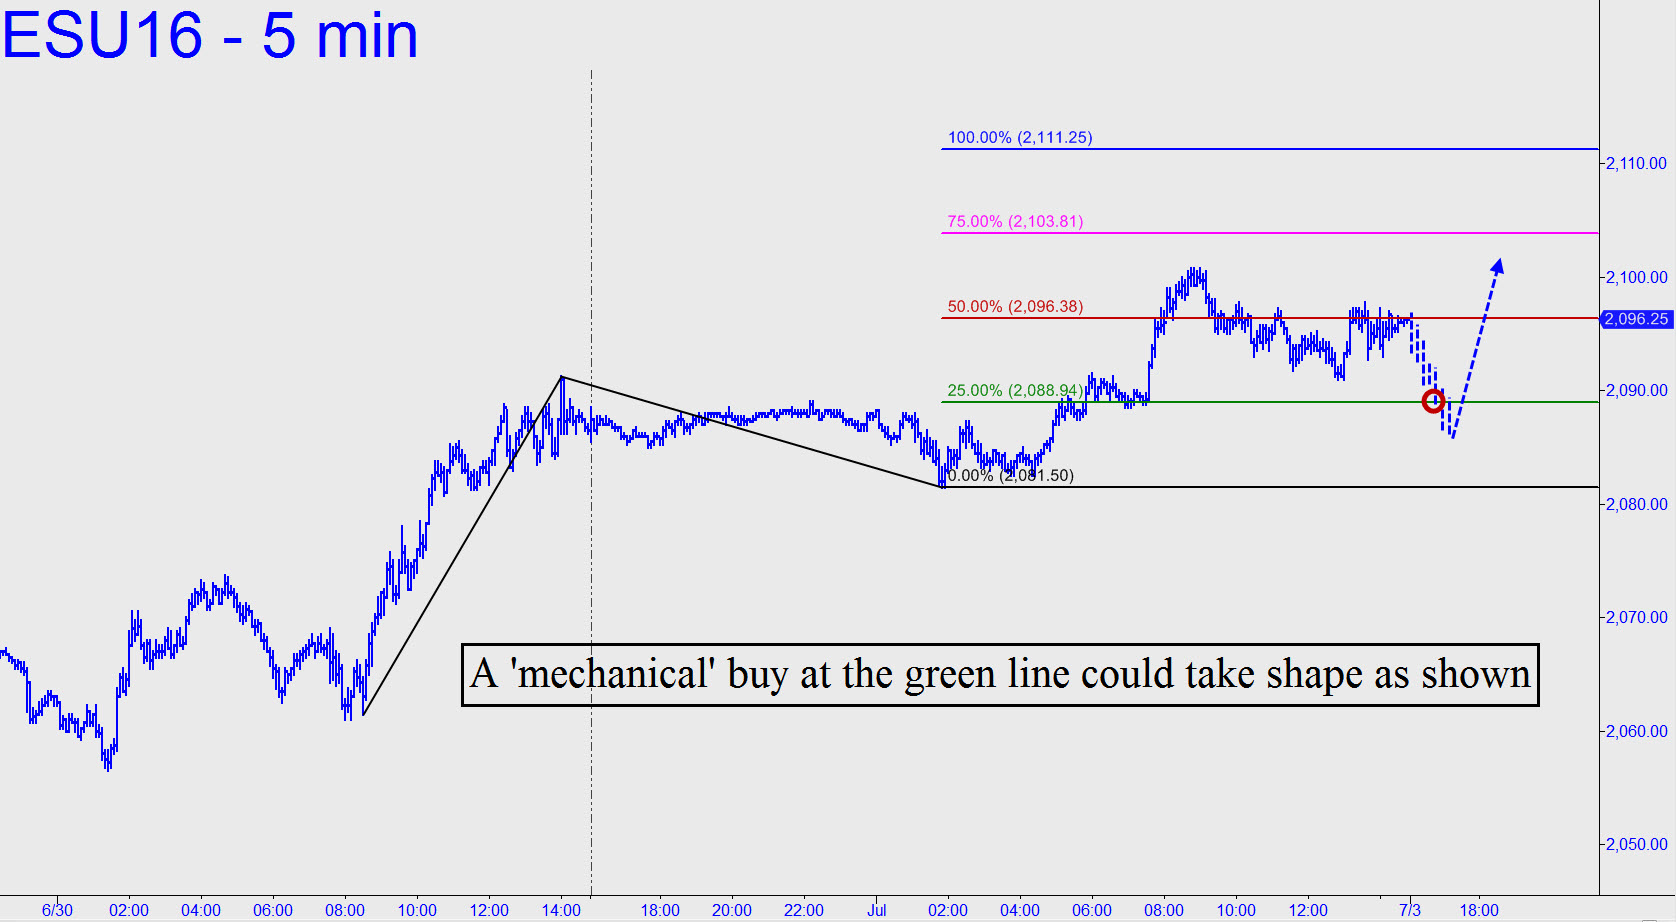
 Use the rally pattern shown, with a target at 2111.25, for any ‘mechanical’ trades from the long side — or shorts, stop 2112.50 (!), if you’re trading aggressively and reversing the position. Assuming the target is hit, that would still leave the futures somewhat shy of the record 2119.50 achieved just before the Brexit vote. Beyond it, I have outstanding targets significantly above — as high as 2240.00, a major Hidden Pivot resistance flagged here earlier. However, before we focus on them, let’s see how well the futures handle resistance at the 2119.50 peak from 11 days ago. (Note: The chart shows one hypothetical ‘mechanical’ trade from among numerous such trades that could be develop at p or p2.) _______ UPDATE (July 5, 10:59 a.m. EDT): Crude prices are down sharply this morning for whatever reason, tugging stocks lower. This shall pass, but until then the futures are vulnerable to more downside over the near term to perhaps 2069.50. ON the 30-minute chart, you can find the target using these coordinates: a=2100.50 (1:00 p.m. on 7/4); b= 2082.00 (5:00 a.m. on on 7/5); and c= 2088.00.
