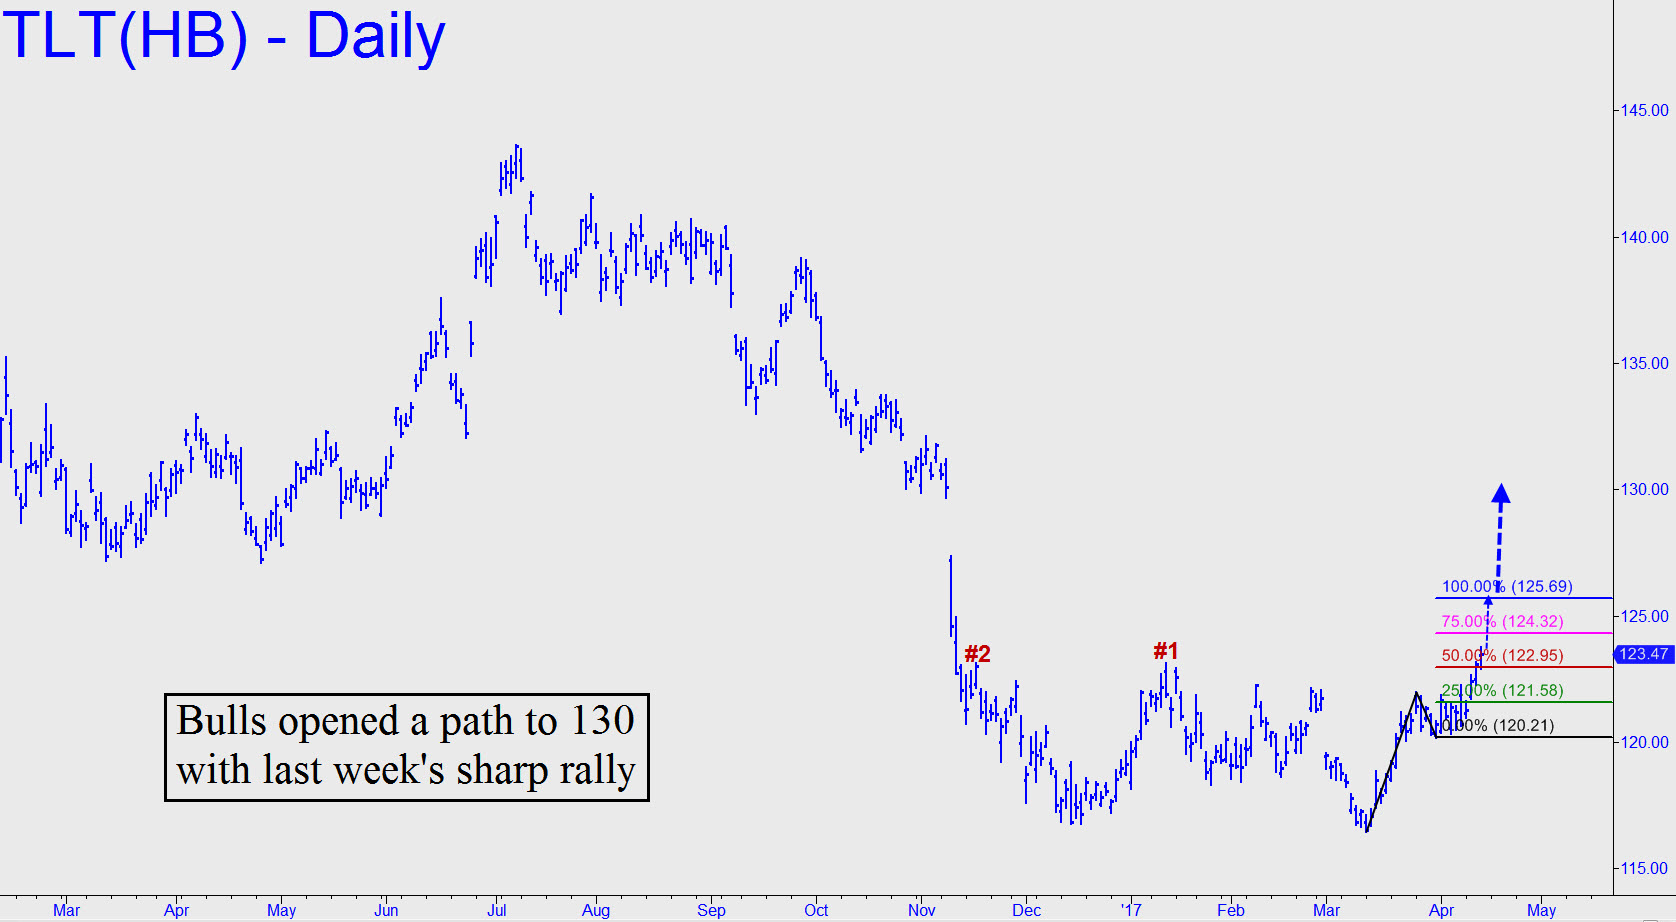
 After moving higher for three consecutive days last week, TLT added a finishing stroke on Thursday that surpassed no fewer than two ‘external’ peaks on the daily chart (see inset). This is the most bullish price action we’ve seen in more than a year, and it implies that buyers will now be training their sights on the 130 level where TLT broke down dramatically just before Thanksgiving. More immediately, the move targets 125.69, a middling Hidden Pivot resistance that we can use as a minimum upside projection. We can also use pullbacks to either the green or red line to set up mechanical entries. If you’re unfamiliar with this tactic stay tuned to the chat room and Scoreboard for guidance in real time, since I will signal if a pullback meets our simple entry criteria. ______ UPDATE (Apr 17, 7:55 p.m. ET): The quick pullback to the red line implies TLT probably has some more backing and filling to do before it takes another leg up. If it pulls back all the way to the green line, however, use a bid there, stop 120.20, to get long. Stay tuned to the tout if you’re keen on the trade,since I may update this guidance.
