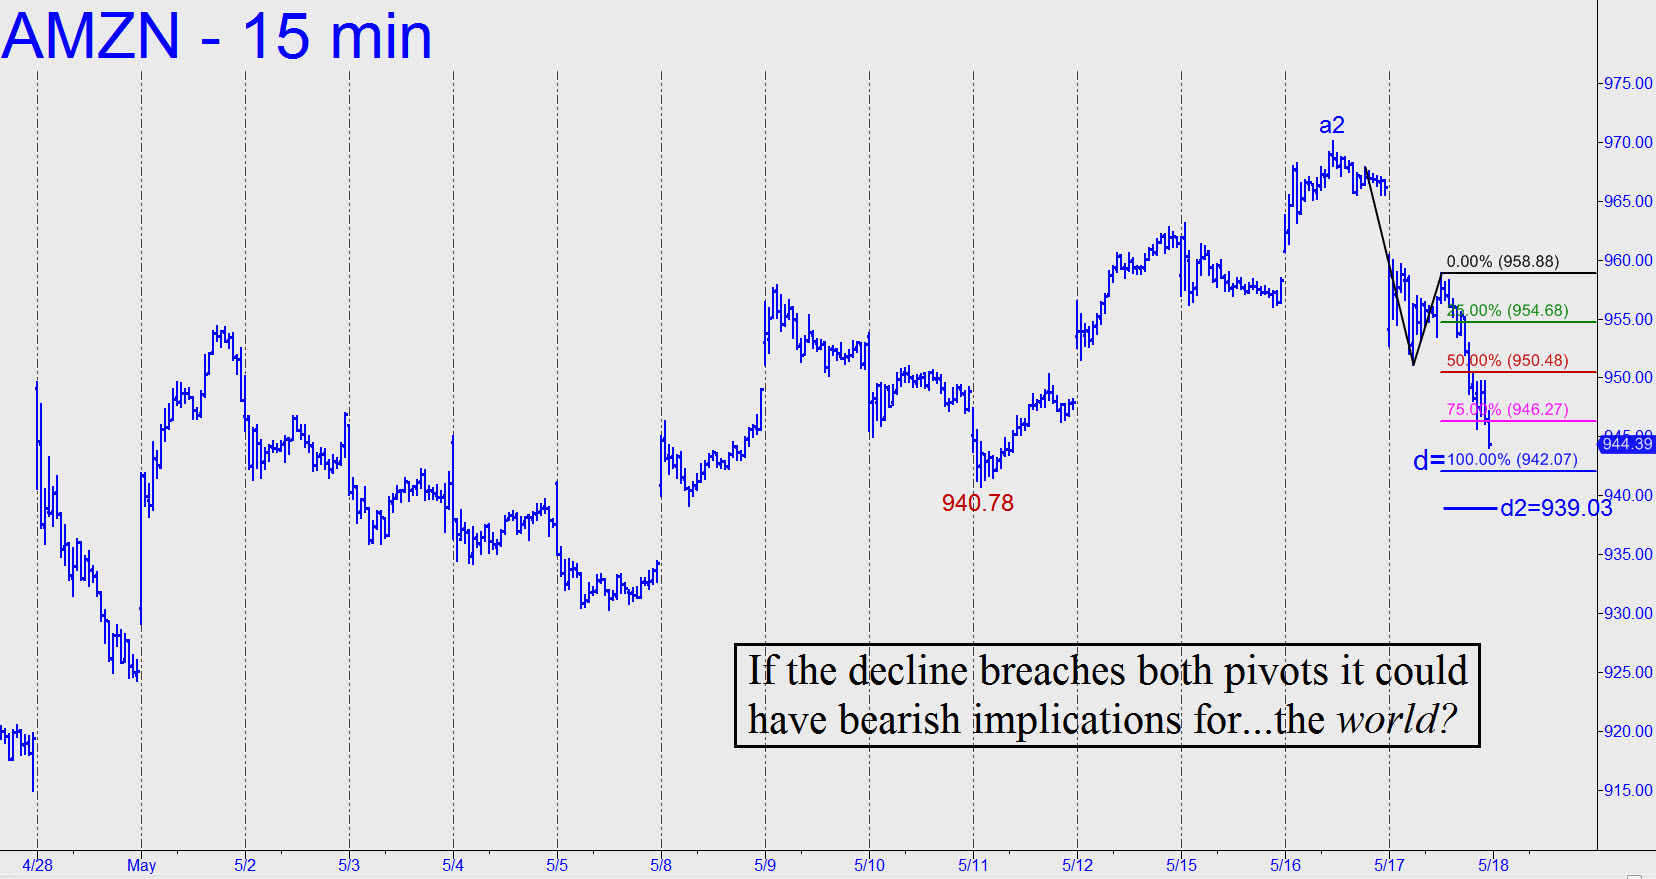
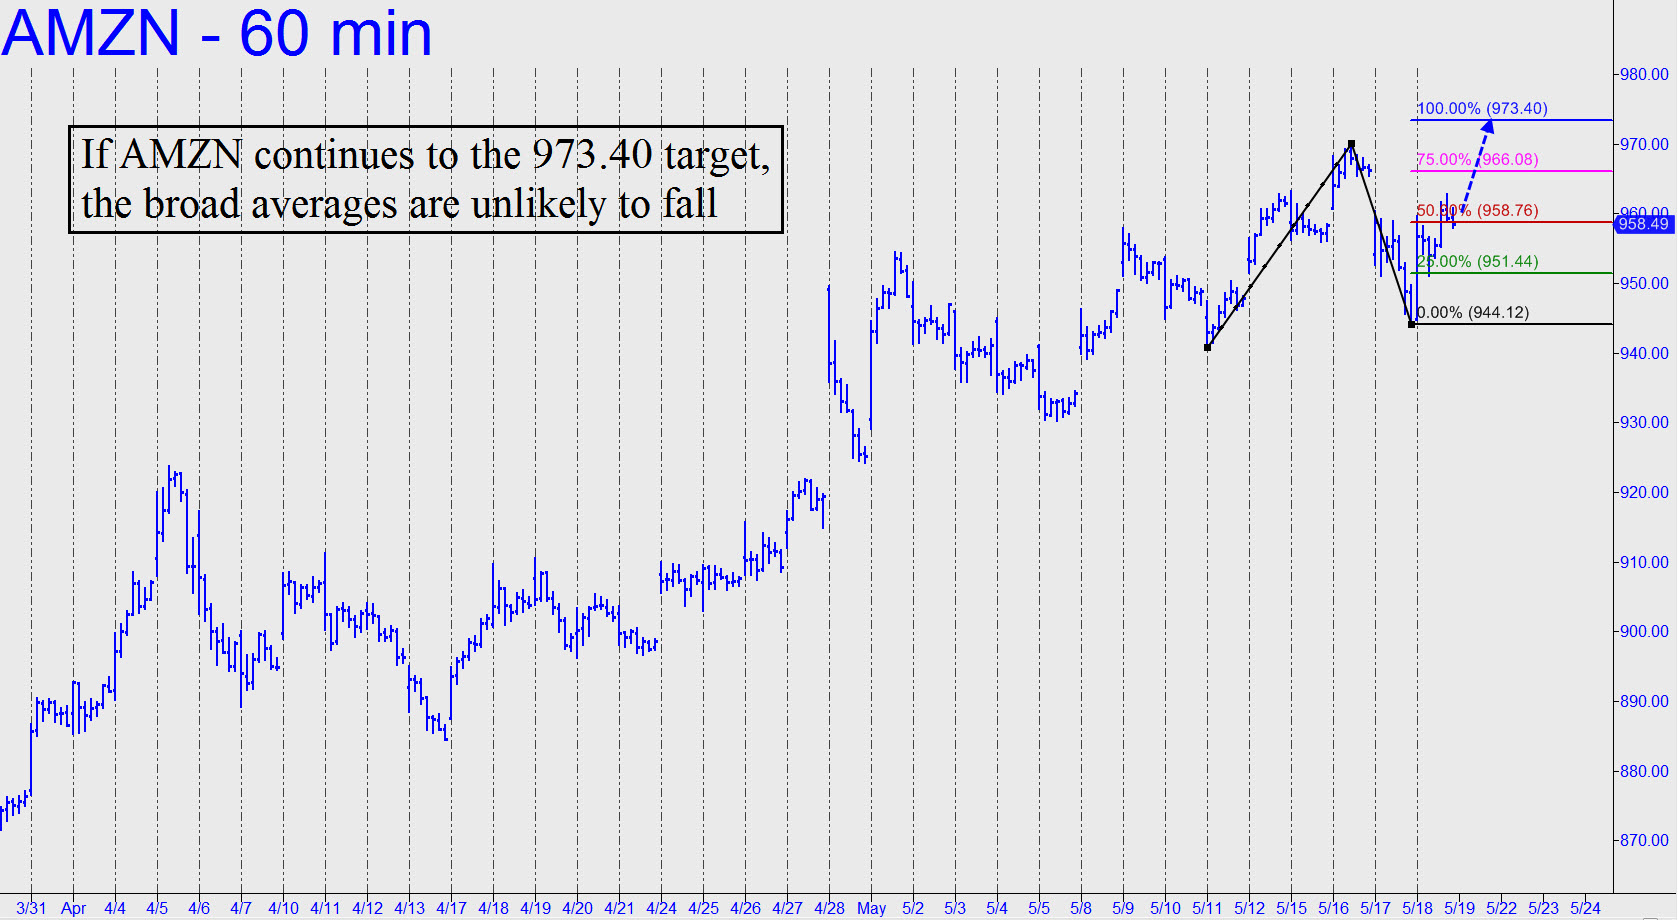
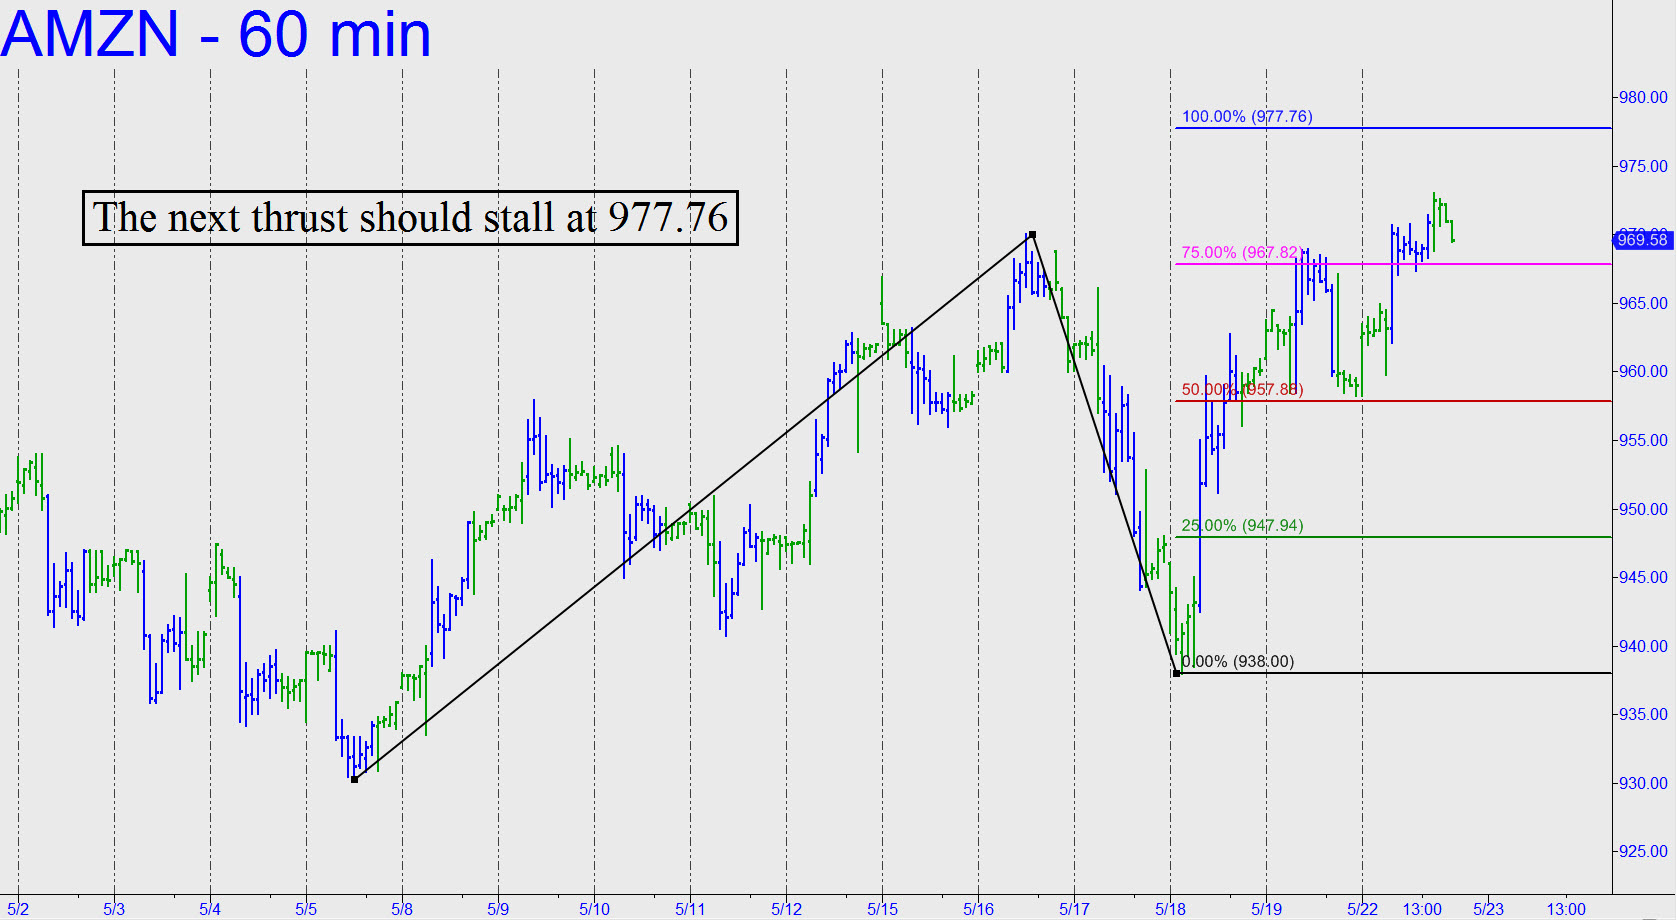
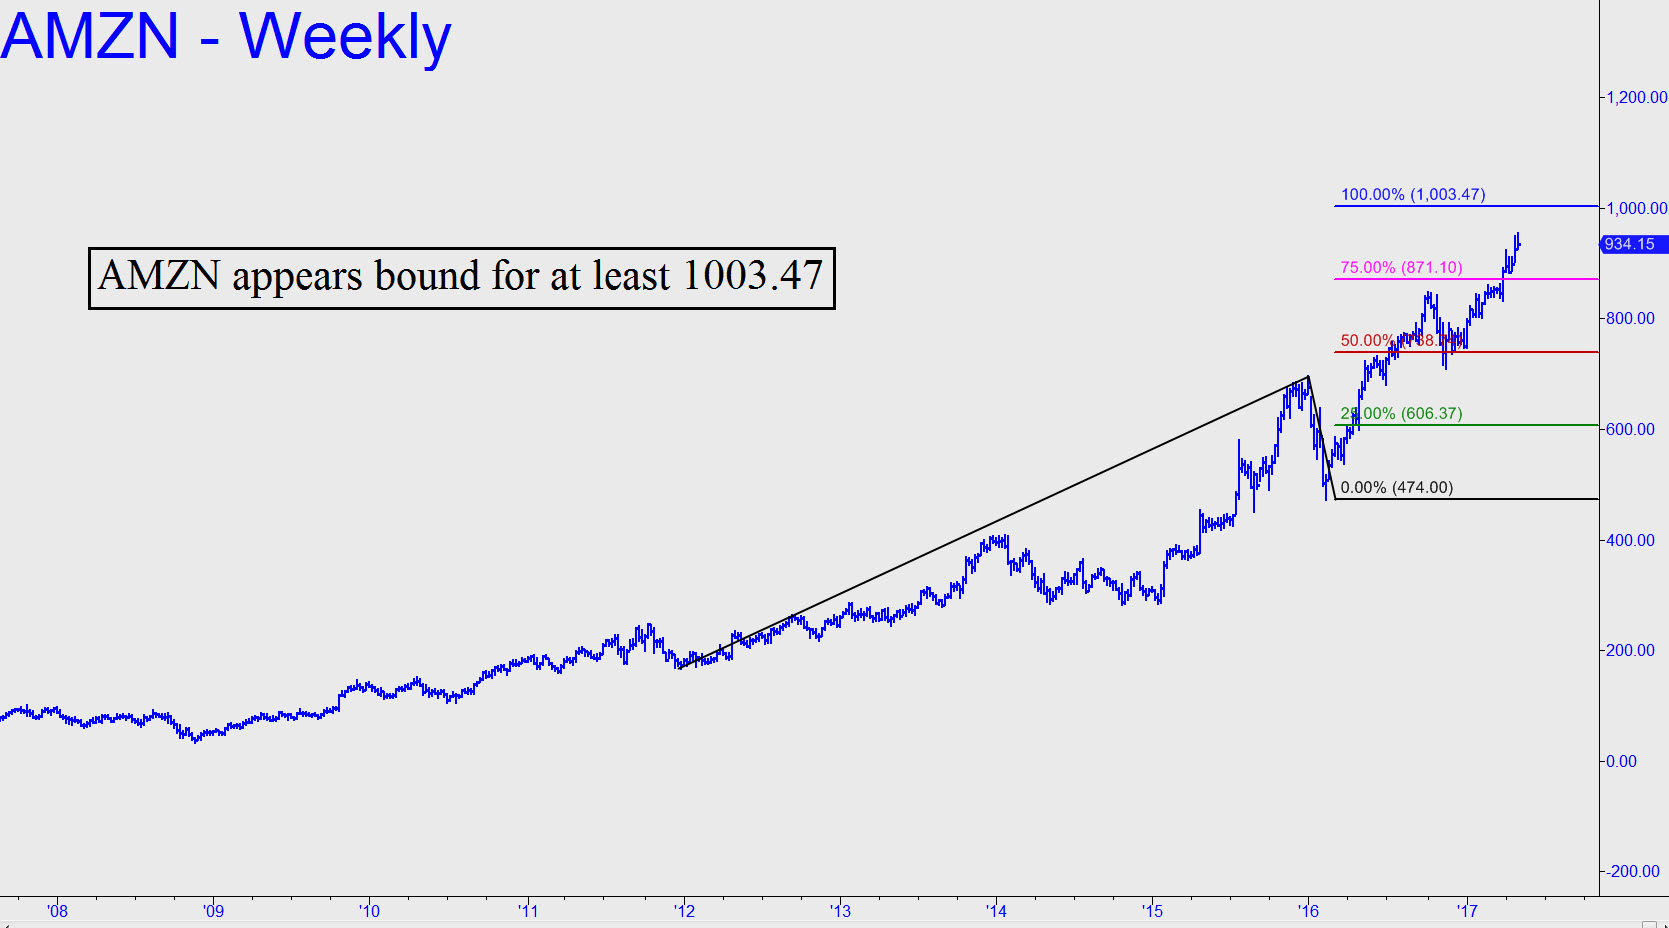
 Two Hidden Pivot rally targets loom on the immediate horizon: 974.24, a number that has served us well in recent weeks as a minimum price objective and which comes from a minor bull cycle begun in late March; and 1003.47, which derives from a pattern dating back to December 2011. Judging from price action at their respective midpoint pivots, AMZN should have little difficulty reaching the higher target, although I would expect a presumably tradeable pullback precisely from the lower. The upper number has the potential to mark the end of the bull market, but with the caveat that there could be one final burst to 1064.64, or even 1135.76. That last number would max out the weekly chart, and if the stock were to get there I’d bet aggressively against any further progress. Until then, we should trade the stock with a strongly bullish bias, using HP levels to initiate trades in the least risky way possible. _______ UPDATE (May 18, 12:04 a.m. ET): AMZN will need to fall to at least 942.07 (or 939.93 if any lower) before it can turn around (click here for chart). If the lower Hidden Pivot support is exceeded by more than a dollar or two, however, breaching the 940.78 ‘external’ low as well, that would imply more weakness to come, possibly after an upward correction. Since AMZN is the most important bellwether stock of them all, this would hold bearish implications not only for the stock market, but for the entire global universe of egregiously pumped financial assets. _______ UPDATE (May 18, 9:18 p.m.): AMZN out-bounced all of the other FAANG/lunatic stocks today, affirming its exalted position in the hierarchy of stocks coveted by portfolio managers. It was in fact a ‘counterintuitive’ buy at 951.44 on the pattern shown, even if a buy-stop limit would not have gotten one aboard. Let’s see if it can reach the 973.40 target. If it does, the broad averages will probably do no worse than move sideways. _______ UPDATE (May 21, 6:04 p.m.): The stock relapsed after a rally died more than $4 shy of the 973.40 target, but this failed to generate a bearish impulse leg on the hourly chart. We’ll watch from the sidelines Monday morning to see what new bedevilment this world-beater has in mind. ______ UPDATE (May 22, 9:14 p.m.): In after-hours trading AMZN has come within 40 cents of the 973.40 target given above. If you used it to get long you should have exited there, just ahead of the so-far $3.50 drop that has occurred since. If the stock gets second wind, look for a potentially more enduring top at exactly 977.75. (Click here to see this graphically.)