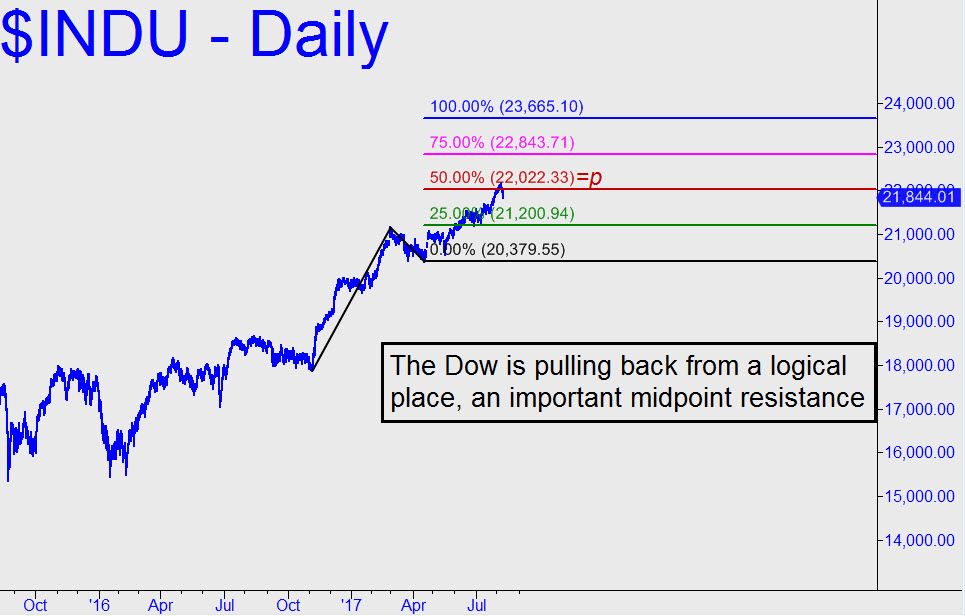
 The Indoos have recently sailed past a 21763 target derived from a nine-month uptrend on the daily chart, so I’ve hauled out the weekly chart for a look at a much bigger picture. It projects a possible bull-market top at 23317 while leaving room for yet higher targets. Even so, the ABC rally pattern shown offers enough clarity to suggest that when the Dow hits 23317, the Hidden Pivot is not going to give way easily. As to the likelihood that this number will indeed be reached, I would say there’s about an 85% chance. Mainly, it is a matter of how buyers smoked the midpoint Hidden Pivot resistance at 19343 the first time they encountered it. Moreover, the first pullback that followed failed to come down to the red line, demonstrating that Mr Market was, and still is, in no mood to defer to timid bulls who are hesitant to jump aboard. If he runs true to form, the pitch of the rally is likely to steepen in the weeks ahead, perhaps producing the blowoff top that so many of us have patiently awaited for so long._______ UPDATE (Aug 10, 7:34 p.m.): Today’s selloff did no technical damage whatsoever to the daily chart. In fact, the pullback occurred from a price where we might have expected it — i.e., at the 22,022 midpoint Hidden Pivot shown (click here). Traders please note: A strong ‘mechanical’ buy signal would be generated if the retracement continues to the green line at 21,200.
