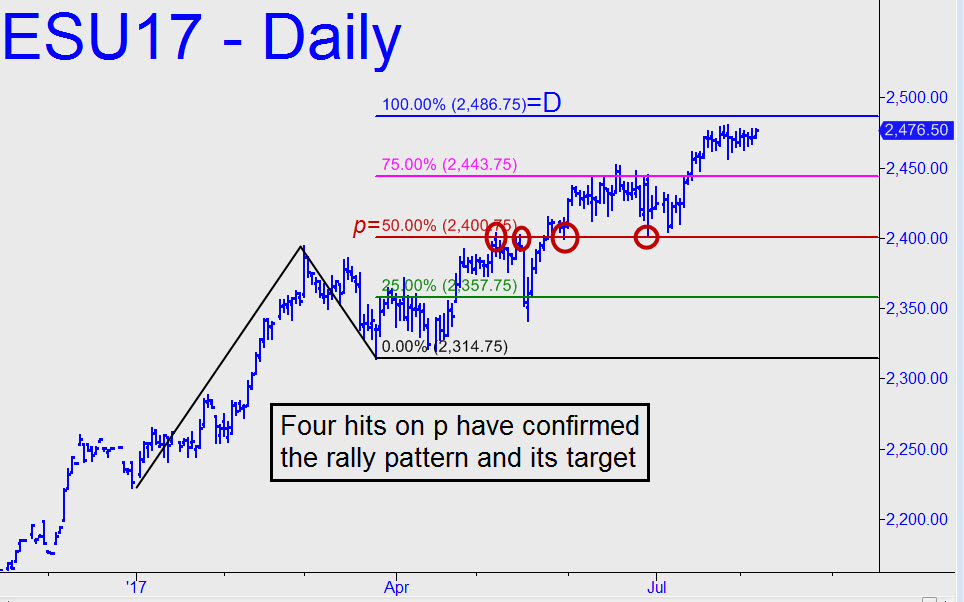
 We’ve been using a 2489.50 rally target derived from a minor ABC pattern that originated on July 18. However, the 2486.75 target shown has a much longer history — one dating back to January of this year. It also has been confirmed by no fewer than four precise hits on the red line since May. Taken together, these two Hidden Pivot resistance points suggest there is considerable stopping power just above. This might seem unlikely, given that the futures have spent the last three weeks in a tight range that looks like a textbook consolidation for a move significantly higher. But could all of it be about to produce a rally of just 10 points? That’s what the chart seems to say. You can short the lower number using a ‘camouflage’ trigger, but I wouldn’t risk more than five ticks theoretical on the entry. If the trade goes in-the-black, please let me know in the chat room so that I can determine whether to establish a tracking position.
