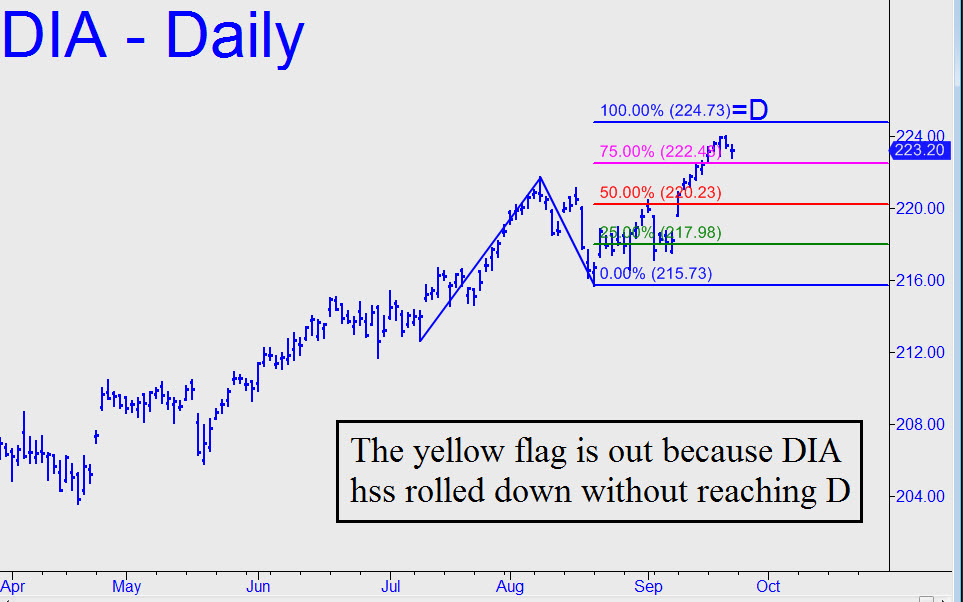
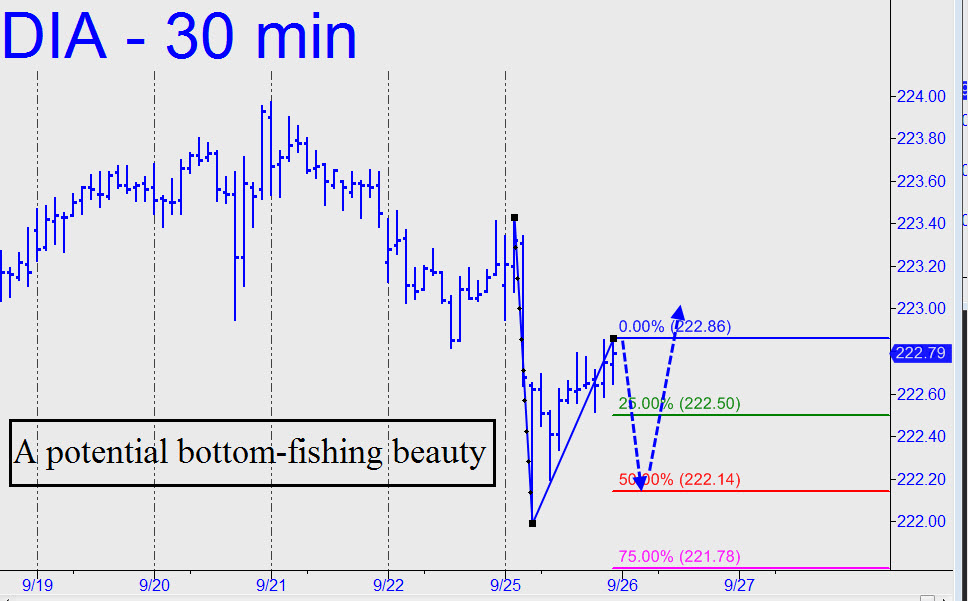
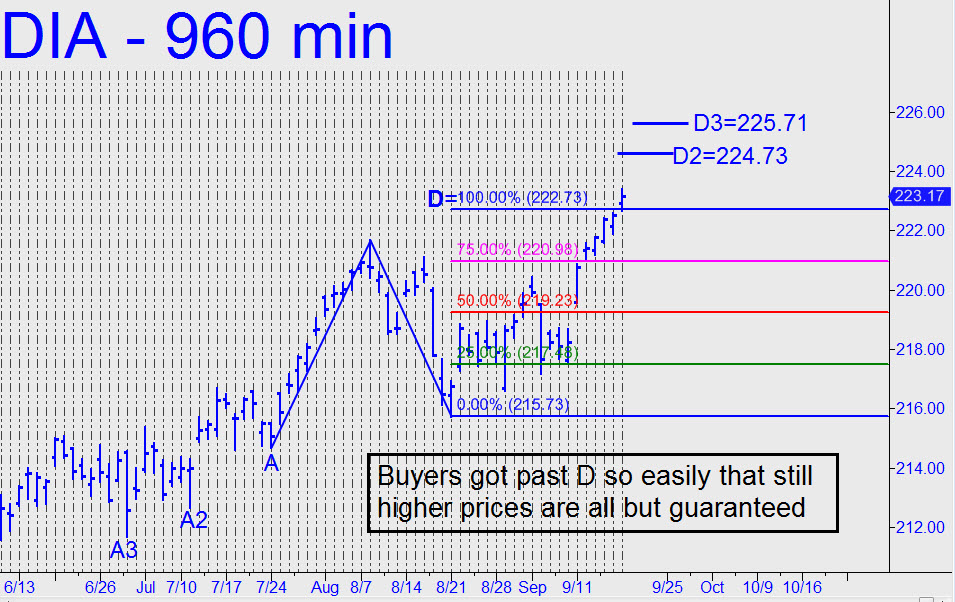
 I don’t often use the 960-minute chart, where each bar represents two full days of price action, but I am doing so now because it offers superb clarity with respect to trend strength and price. Notice how DIA barely paused before shredding a 223.18 Hidden Pivot resistance Monday that we might have expected to act like concrete. This strongly implies that DIA is about to head even higher, presumably to at least D2=224.73, or to D3=225.71 if any higher. I expect these Hidden Pivot resistance points to act precisely, meaning easy progress through the lower would be reason for us to confidently infer that the higher is apt to be reached. Either can be used to lay out shorts stopped as tightly as 6 to 8 cents. ________ UPDATE (Sep 24, 5:22 p.m. EDT): The yellow flag is out, since DIA has begun to roll down from a record high that nonetheless failed to reach the Hidden Pivot target at 224.73 that I’d noted above. (click here to see chart). The weakness could be temporary, but we’ll back away for the time being regardless. ______ UPDATE (Sep 25, 11:09 p.m.): Here’s a trade that corresponds to one I’ve flagged in the cash Dow if you want to interpolate it using options or DIA. You can adjust the midpoint pivot upward if ‘C’ migrates north overnight but has traded no higher than 223.20 or so. ________ UPDATE (Sep 26, 5:15 p.m.) Today’s nutty, gratuitous spasms proved unworthy of our attention. By averting our eyes for a day, we can avoid letting it happen again on Wednesday. ________UPDATE (Sep 28, 12:16 a.m.): The target at 224.73 given above now looks certain to be reached. Plan on shorting there any way you choose, but be aware that if DIA closes above 225.00, the 225.71 target will be in play as a minimum upside objective. ________UPDATE (Sep 28, 10:40 p.m.): Check tonight’s chat room entries around 8:35 p.m., since I’ve posted a potential ‘jackpot bet’ for this vehicle ahead of Friday’s opening.