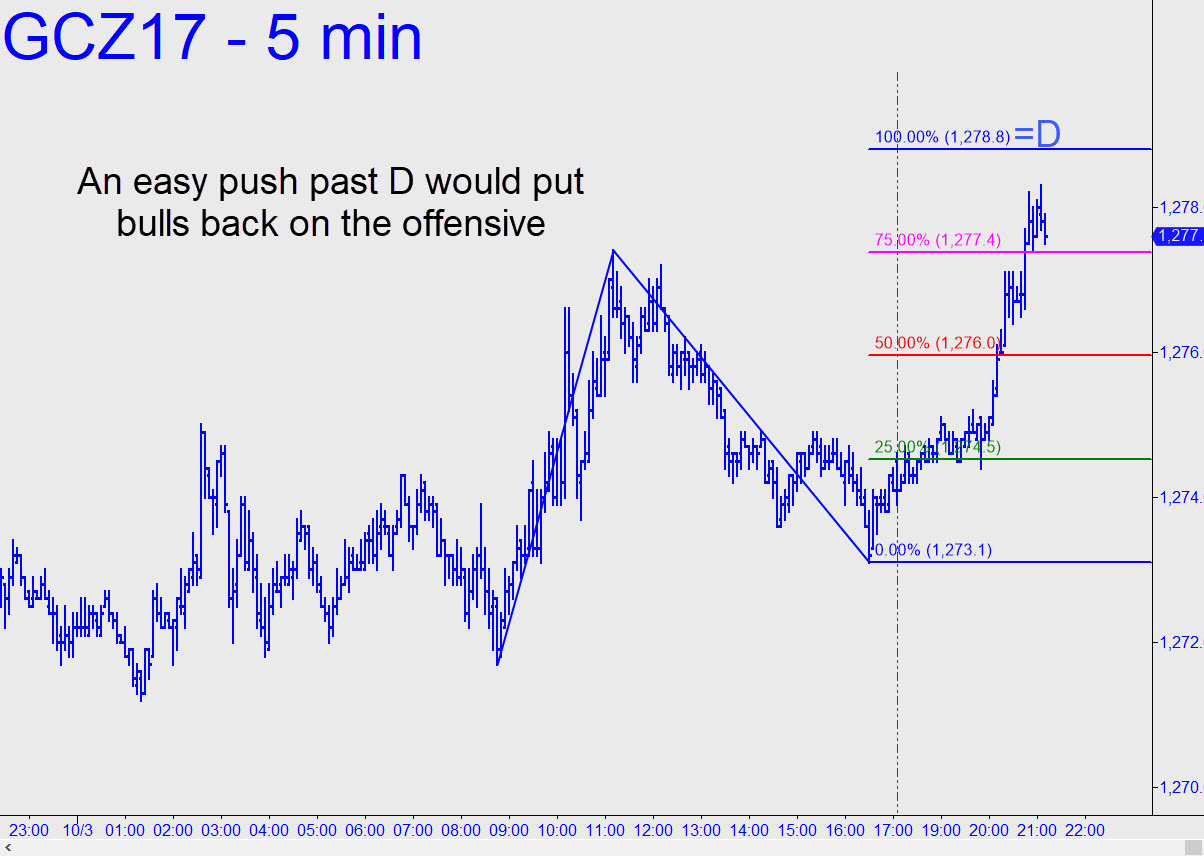
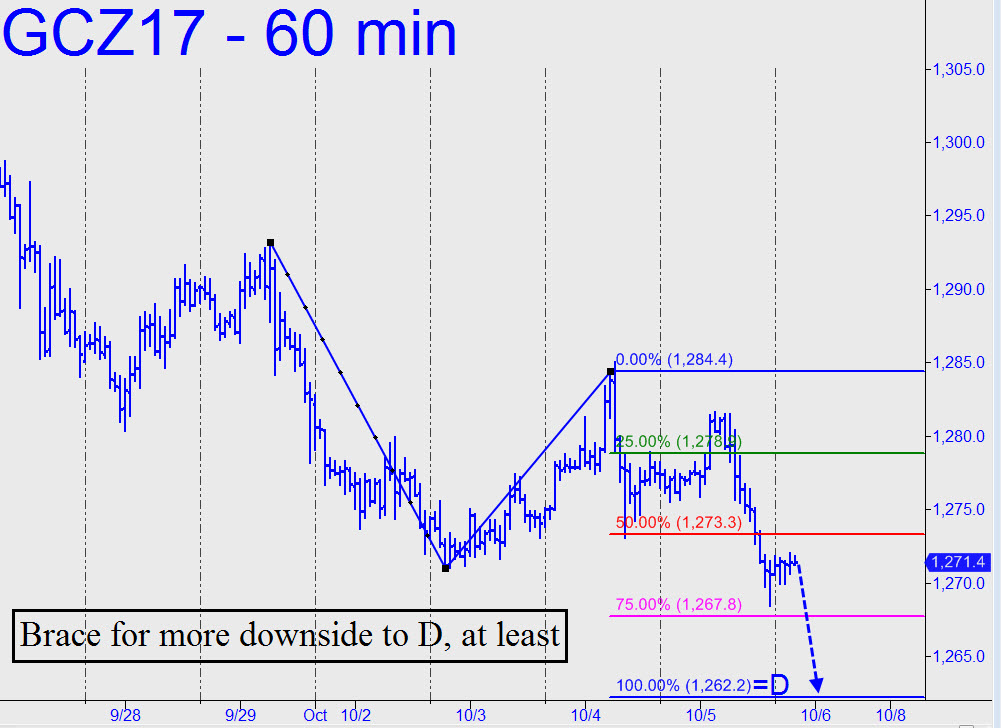
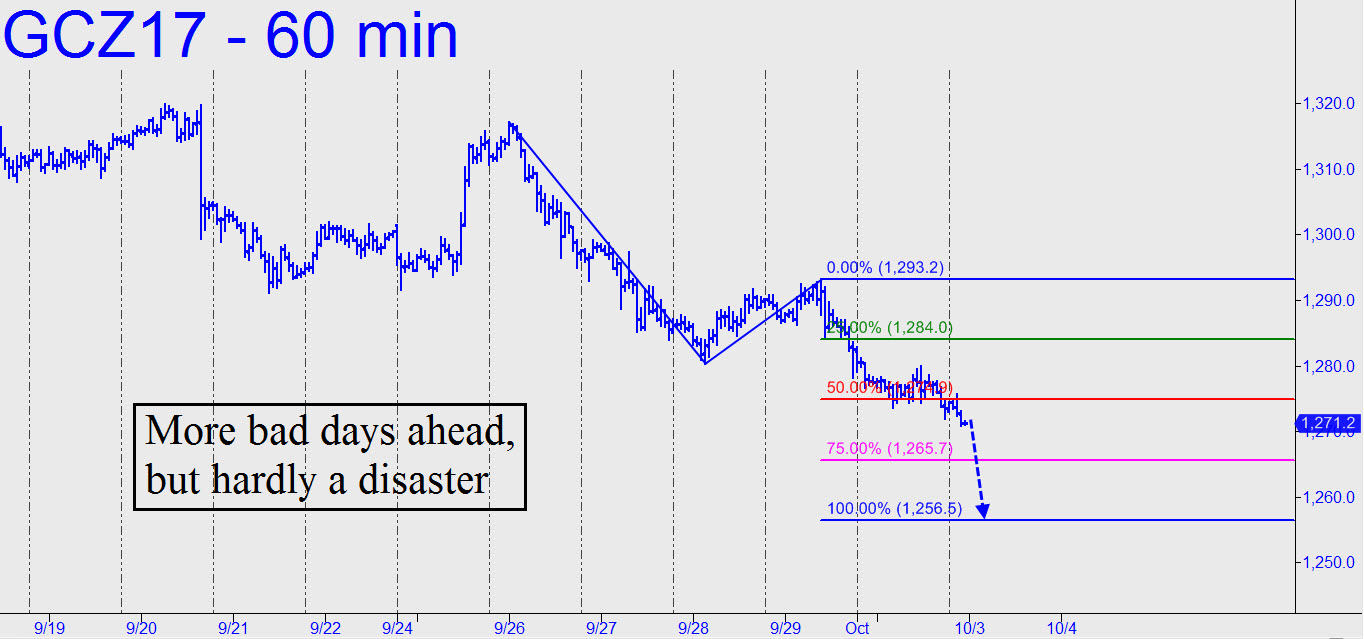
 A bearish target at 1270.20 has kept us on the right side of the trend. But with the futures currently within a few ticks of our number, it’s time for a new one: 1256.50. This is little stuff, for sure, but make no mistake, it will always be useful to know: 1) exactly how far the trend is likely to go, minimum; and 2) how much resistance the target is likely to offer. In this case, a drop to at least 1256.50 over the next few days seems all but certain; a tradeable bounce from within a few ticks of it almost as certain. This gambit will be catch-as-catch-can: Trade ’em however you like, but with the conviction that the target above is going to work like magic. _______ UPDATE (Oct 3, 9:25 p.m. EDT): A moderate rally was continuing into the night session, promising to deliver 1278.80 (click here for chart). Let’s wait and see how buyers handle this Hidden Pivot resistance, since they’ll need to push past it with ease to suggest they’re ready for significantly more. The big-picture target you shouldn’t lose sight of lies at 1462.70 (daily chart, A= 1073.00, 12/31/15). Traders please note: A pullback to the green line (x) of the big pattern would trip a ‘mechanical’ buy signal at 1220.60, stop 1139.60. __________UPDATE (Oct 4, 5:46 p.m.): Buyers delivered 1285.00, somewhat more than we’d asked of them. But because they gave more than half of the gains, the burden of proof is still on the bulls. If they can push this brick above 1293.20, a peak recorded a week ago on the way down, that would be a mildly encouraging step in the right direction. _______ UPDATE (Oct 5, 7:15 pm.): Easy come, easy go. But then, we’ve grown accustomed by now to gold’s smackdowns every time it briefly gives us something to cheer about. This selloff should hit 1262.20 at least (click here for chart), but a decisive breach of that Hidden Pivot support would imply still-lower prices to come.________UPDATE (Oct 6, 9:15 a.m.): Gold bottomed to-the-exact-penny at a 1262.80 Hidden Pivot target based on the pattern’s correct point ‘C’ high, 1285.00. The pattern I drew originally was slightly off, but it didn’t change my basic analysis. The rather substantial bounce so far has hit 1278.00, and I do hope that subscribers who pointed out my error in the chat room were able to use their own, correct target to get long precisely at the low. If so, please let me know so that I can determine whether to establish a tracking position..