
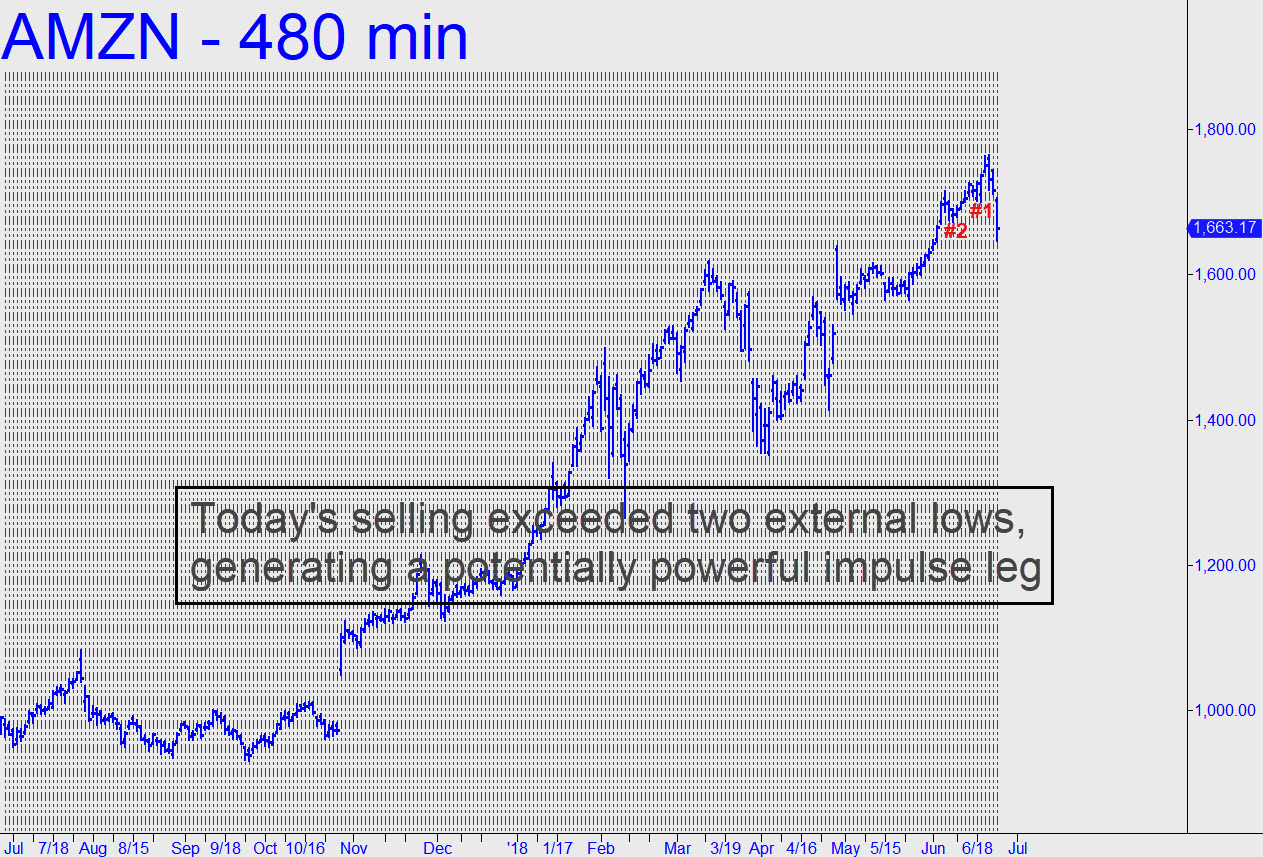
 Monday’s powerful selloff in AMZN — the heart, soul and muscle of the bull market — did serious technical damage to the stock’s daily chart. It’s been almost a year since we’ve seen a similar occurrence. That one led to a bull market that saw the company’s shares nearly double in price. However, at these heights, it seems extremely unlikely that this will recur.
Over the last six months, I’ve repeatedly asserted that AMZN is the only stock we need watch to gauge the strength of the bull market. That still holds. The company has a huge presence in the retail sector, global reach and the savvy to dominate any market in which it chooses to play. If AMZN is at the beginning of a hellacious dive, then so are the broad averages. For a more detailed technical assessment, check out my latest update for AMZN in the tout below. From a technical standpoint, it appears extremely unlikely that sellers are spent. Given the impulsive nature of today’s downthrust, a further implication is that the stock’s next big rally will be corrective and therefore a potential shorting opportunity. Even so, we shouldn’t expect the AMZN’s cunning sponsors to make it easy for us to pile on.
Uh-Oh! ‘No Sign of Panic’
One further, distressing note: Today’s selling was far too calm to be climactic. The ARMS index, a very useful tool derived from the Advance/Decline line, sniffed no panic whatsoever in today’s plunge. This suggests very clearly that complacency still reigns. Although it is said they don’t ring a bell at the top, this may be as close to one as we’re going to get.
Comments on this entry are closed.
AMZN has the possible slingshot turn in place, all markets can only turn on such action.
A sling shot is a price whip saw that has enough energy to create a new trend the other way of an old existing trend. This is done by the last price pivot of the upward trend to be over come from that pivot by the same amount of points in pricing of that last upward move to under the pivot but in the same time frame it took to reach that high from the pivot.
The weekly pivot is 1565.22 week of 05/14/2018 so a 198.00 move towards the new high recently of 1763.10 on 06/18/2018 must be over come with that same time frame to that high point ‘about 6 weeks’ to a low of 1367.00 by at lest 07/30/2018.
Doing so ends the large parabolic trend and the entry into a bear market.
Have a great day Rick.