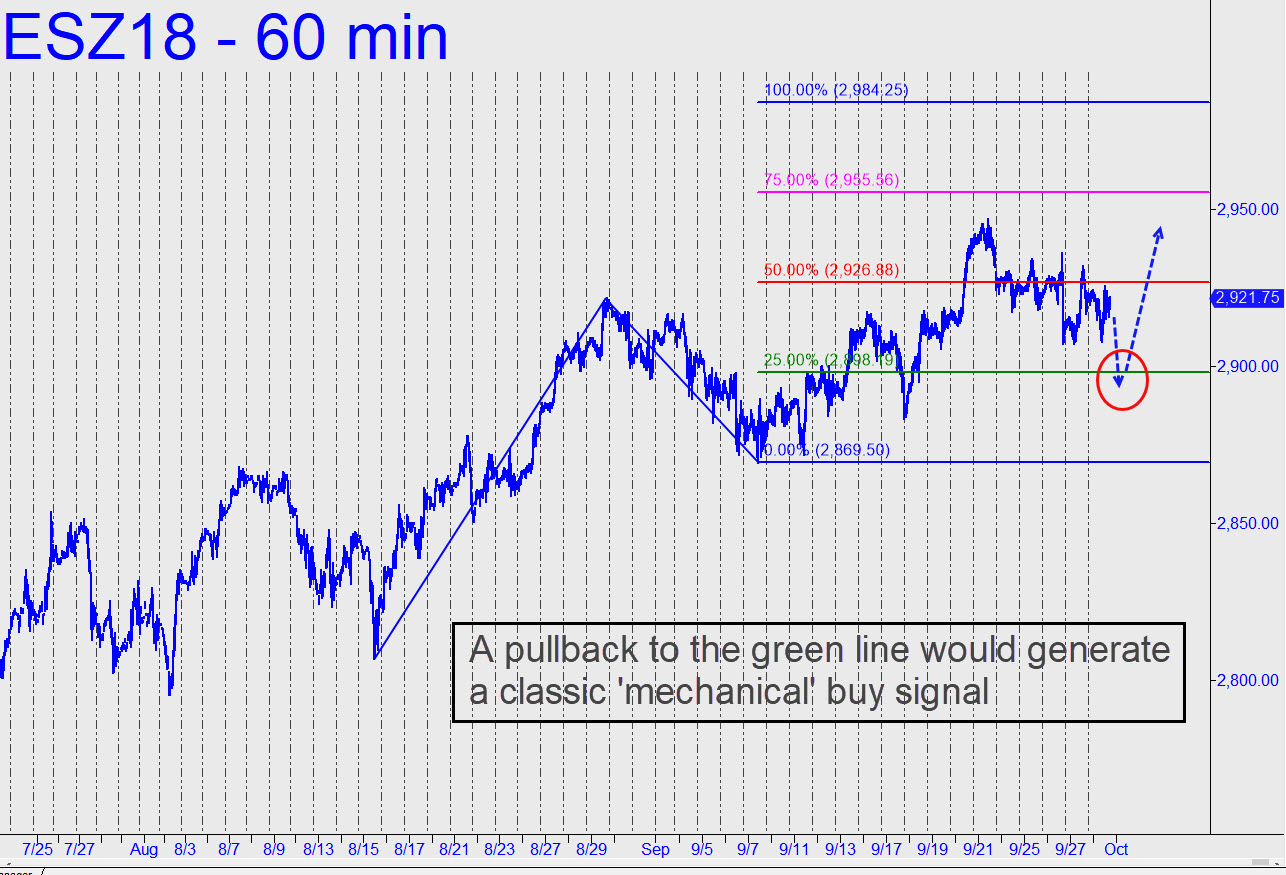
 For the first time in recent memory, the E-Mini S&Ps are looking mildly interesting. Click on the thumbnail chart and you’ll see that a pullback to the green line early this week would meet our technical criteria for an attractive ‘mechanical’ buying opportunity. The exact reasons for this are proprietary and I won’t divulge them here, but suffice it to say, a bid at 2898.00, stop 2869.00, would be appropriate if the futures should fall to that level. Now click here for a longer-term chart that is flashing yellow, with the implication that downside risk outweighs upside potential at the moment. Notice that the December contract has sold off 40 points since topping a hair from a 2949.50 target where we would have turned cautious in any event. Under the circumstances, we will need to watch both charts closely in the days ahead, since a bullish resolution of the smaller chart would diminish, although not negate, the importance of the bearish longer-term chart. Conversely, if the futures stop out a long position initiated at the green line, that would strengthen the possibility that the 2947.00 high will turn out to have been an important one._______ UPDATE (Oct 1, 9:44 a.m. EDT): Stocks have begun the week in hyperdrive, goosed by two bullish headlines concerning 1) Nafta (Canada will join Mexico); and 2) Musk (ousted as CEO but will continue to run Tesla). The move left the mechanical bid I’d advised choking on dust while also generating a bullish impulse leg on the hourly chart. This has slightly increased the odds of a continuation to the 2984.25 target shown.
