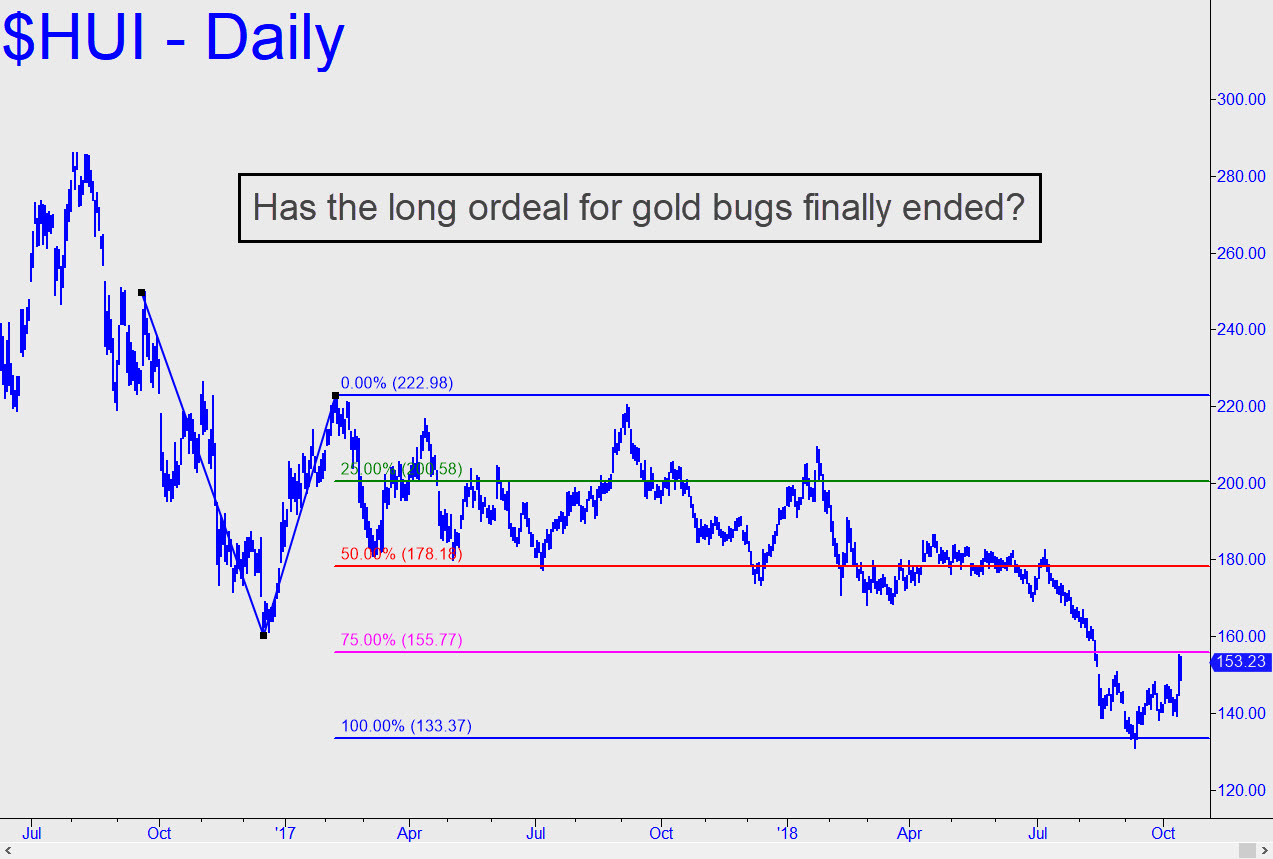
 I haven’t featured the Gold Bugs Index in the touts section for more than two years because my outlook has been so bleak. It may be time to look on the bright side, however, since HUI has turned up from within an inch of a long-term Hidden Pivot support at 133.37. The actual low, recorded a month ago, was 133.12, and it marked the beginning of an 18% rally that has steepened noticeably in the last few days. Buyers would need to hit 162.45 to refresh the bullish impulsiveness of the chart shown — a tick above an ‘external’ peak recorded August 9 on the way down. The peak is a very small one — a look-to-the-lefter, actually — but it is sufficient to give us a handhold for trading if HUI should pull back from above it. Last week’s rally was robustly impulsive on the daily chart, but we’ll need to see a correction and a follow-up thrust to get a better idea of how much power is pushing it._______ UPDATE (Oct 28): HUI took a steep dive last week after topping 3.50 below our 162.45 ‘green light’ threshold. This is disappointing, but merely so, and anyway, we should have become used to such behavior in gold by now. _______ UPDATE (Nov 3): The week ended with a mildly encouraging, bullish impulse leg on the hourly chart. It yields a 151.95 projection, but possibly 156.35 if any higher. _______ UPDATE (Nov 5, 6:02 p.m.): Buyers poked an inch above the 151.95 target, then retreated like sandpipers from the tide. The 156.35 target will remain valid as long as 147.55 is not exceeded to the downside. _______UPDATE (Nov 7, 9:57 p.m.): The 156.35 target has been invalidated by HUI’s moderate pullback, but not the bullishness of the hourly chart. Buyers would need to generate an upthrust of at least $2.63 to jump-start a rally likely to get legs.
