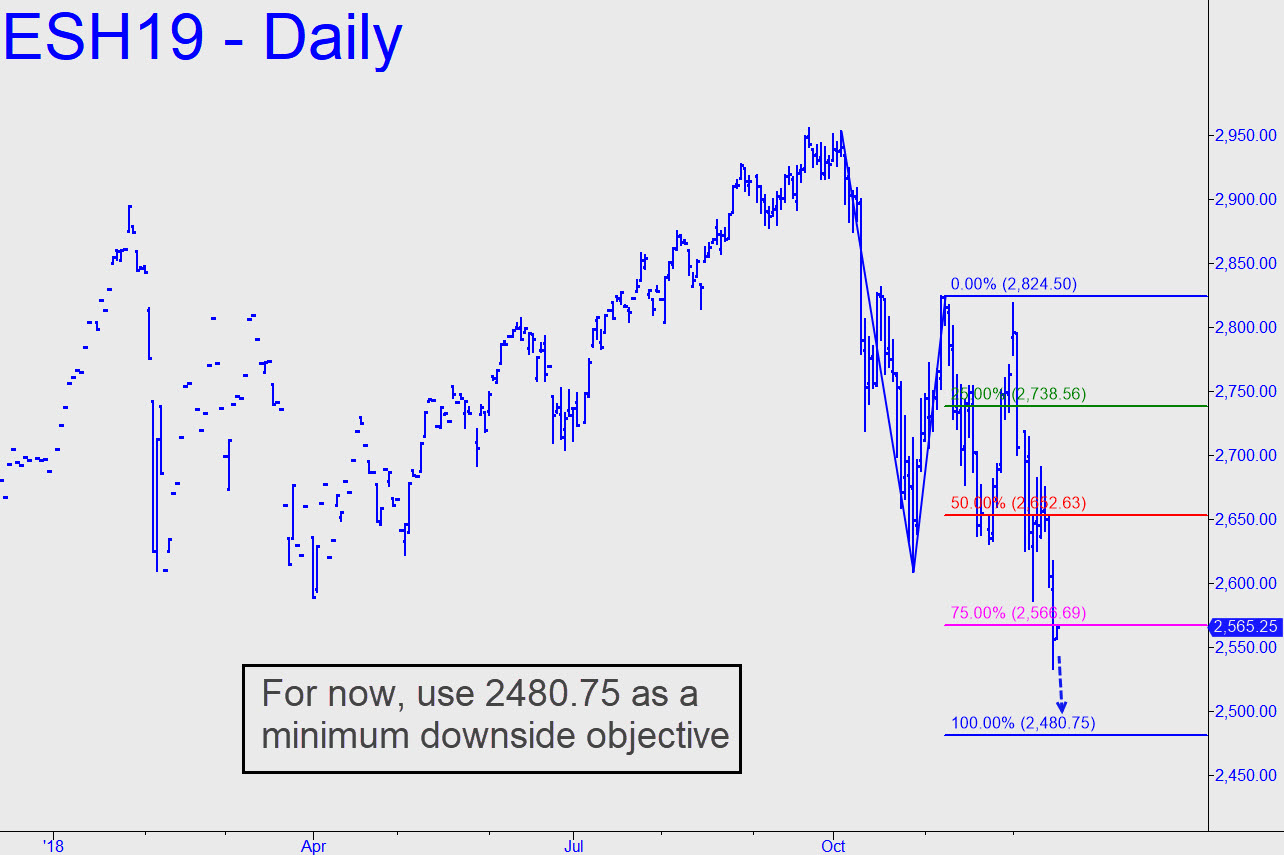
 The pattern shown is well-formed and compelling, with a 2480.75 target that lies 3.3% below these levels. It was not possible to project an equally high-quality target for the expiring December contract because its point ‘B’ low did not exceed a prior low as this one did. The visual differences are slight but nonetheless significant with regard to their respective accuracy and usefulness. Initial downside penetration of the 2652.63 midpoint support was weak, so we should be alert to the possibility of a significant upturn from somewhere north of D — perhaps even from this morning’s 2553.50 low. Odds of this would shorten if the futures are able to push above 2616.75 today. That is where a minor but technically important ‘external’ peak lies, and its breach to the upside would signal a trend reversal capable of getting legs. If it happens, take it as a sign that the FOMC announcement due out Wednesday will be perceived as very bullish — sufficiently so to trigger off the well-anticipated Santa rally — or if you will, a Santa dead-cat bounce.______ UPDATE (Dec 18, 8:51 p.m.): See my comments in today’s The Morning Line for a detailed outlook for Wednesday and beyond. Most immediately, downside targets at 2504.25, then at 2480.75, will remain in force unless a rally exceeds, respectively, 2576.25, and thence 2824.50 (yes, you read that last figure correctly)._______ UPDATE (Dec 19, 8:56 p.m.): A so-far modest bounce has occurred from a 2489.50 low that missed my 2480.75 target by 9.25 points. Ordinarily the failure of a downtrend to hit its mark would be mildly bullish, but only when the subsequent bounce starts exceeding external peaks on the intraday charts. A small one sits just above at 2519.00, but I’ll want to see a more important one at 2568.00 exceeded before I’m persuaded bulls mean business. Here’s the chart.
