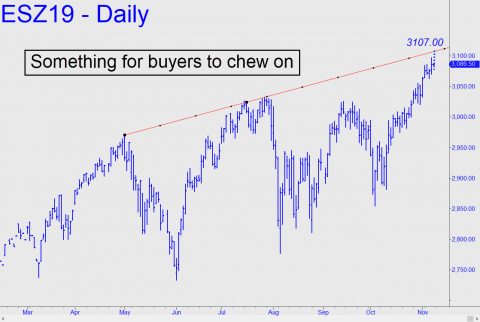
 So when is Mr. Market going to wipe the stupid grin from bulls’ faces? Soon, would be my guess. Check out the trendline in the chart. A pisher it ain’t. It connects the peaks of two major rallies and goes back more than seven months. And here are two more trendlines that are arguably even more daunting. The first shows the New York Composite Index (NYA) and comes from Peter Eliades. It first appeared here more than a month ago. The second shows the Industrial Average. If these trendlines fail to stop the bullish wilding spree dead in its tracks, then technical analysis is just toad entrails and tea leaves. All three resistance points lie not far above current levels, implying that the manic rally in U.S. stocks could continue into next week. ‘Freaky Friday’ is not usually a reversal day, so we should brace for more of the same, at least for now. _______ UPDATE (Nov 7, 10:19 p.m.): DJIA popped through its respective trendline like it wasn’t there, hitting a high nearly 200 points above it before settling at the midpoint of the day’s range. This is quite impressive, and there is no denying it is very bullish. Let’s see how NYA and the E-Mini S&Ps (see below) do.
