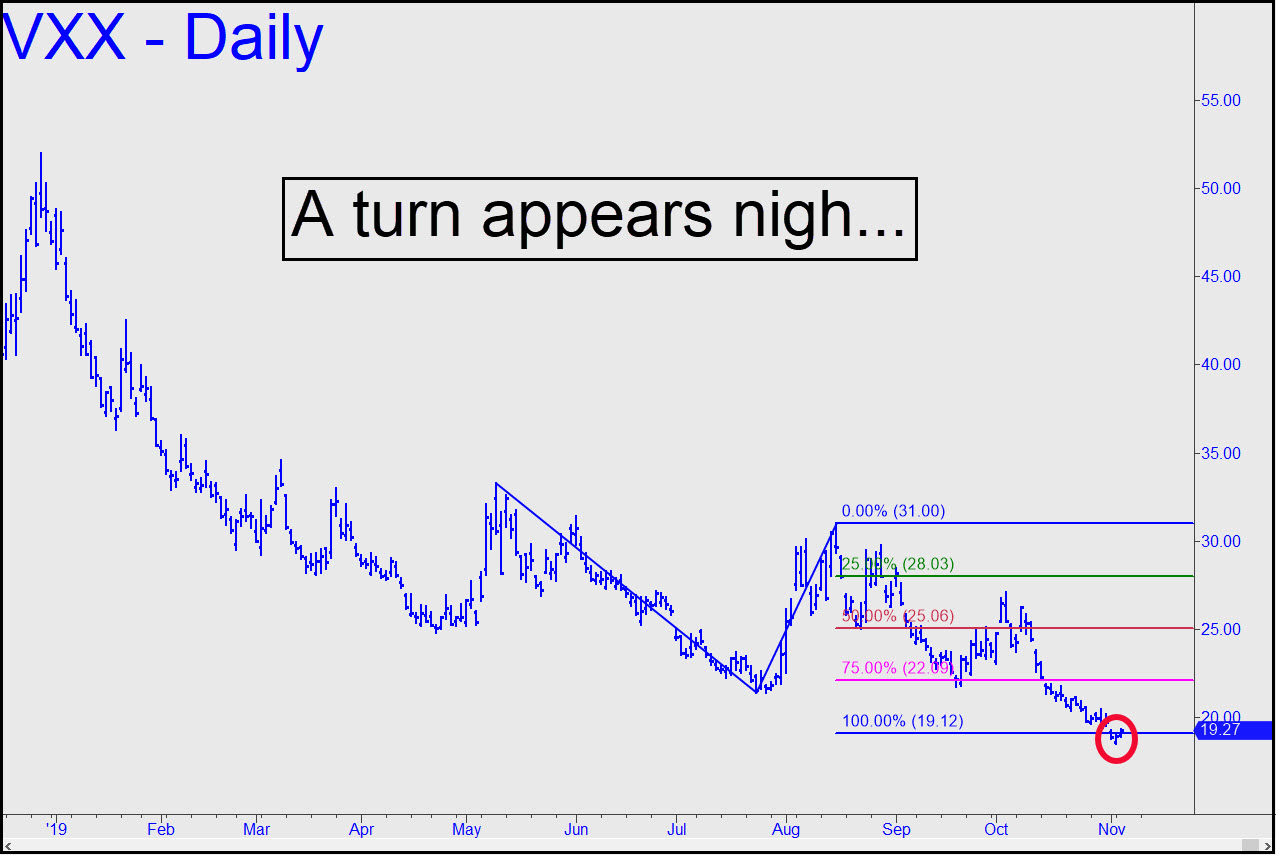
 The S&Ps and Nasdaq 100 have fallen moderately after overshooting important Hidden Pivot rally targets on Monday that I might have warranted as impenetrable. This is bullish, as is the fact that AAPL, our #1 bellwether, still has an outstanding target about 10% above current levels. Even so, and despite the fact that the U.S. economy has “never looked better,” we shouldn’t be too trusting of the rally. The chart shows that VXX, which tracks short term volatility in the S&P 500, may have reached an important bottom. If it is about to reverse, that would imply stocks are about to fall. I trust this indicator more than I do all others at the moment.

Comments on this entry are closed.
Hello, Rick. The Hidden Pivot Method tells you, and us, that the VXX appears to have nowhere to go but up. Yet, the HPM is not infallible (in other words, you wouldn’t recommend, just now, backing up the truck to buy calls, for example). So, although, of course, eventually the VXX will rise, how much would it have to fall for you to revise your near term expectations? Is your crystal ball telling you that pull back, or as much as a correction, in the S&P’s is likely to come by Thanksgiving?
&&&&
Might I suggest that you subscribe to Rick’s Picks as soon as possible? The answers you seek are the substance of what paying subscribers get each day. RA