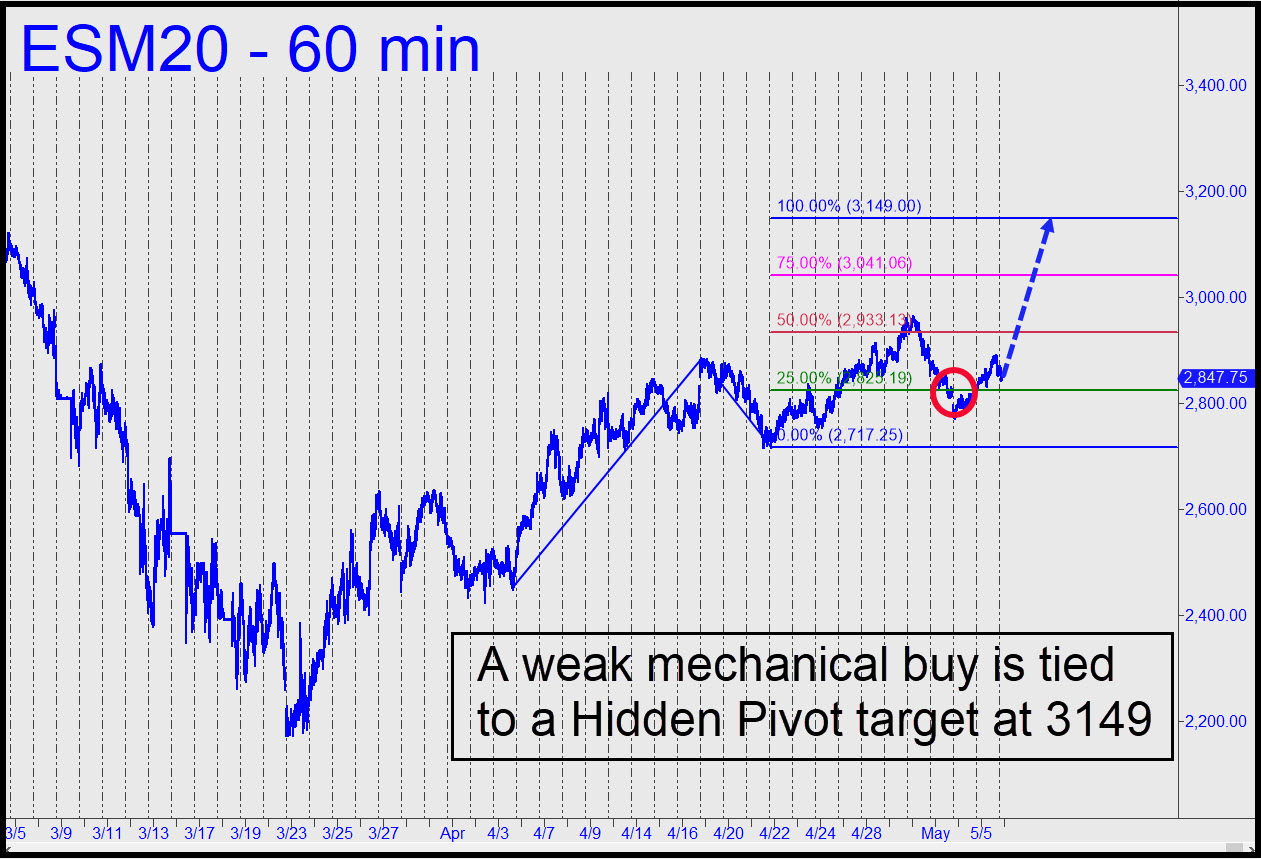
 Today’s chart shows an ambitious target at 3149.00 — a swing-for-the-fences number that will spare us the annoyance of adjusting upward every time a lesser target is reached. The Dow would be trading within 10% of all-time highs at that point, the S&Ps within 7%. This may sound farfetched considering the state of the economy, but I’d lay even odds on this bet for three reasons: 1) the A-B impulse leg is the real McCoy, having exceeded a daunting external peak recorded on March 10; 2) the B-C leg has traded above the 2933.25 midpoint resistance; and 3) Friday’s downdraft triggered a ‘mechanical’ buy, albeit a weak one. All things considered, the pattern suggests 3149.00 has a good chance of being reached, perhaps after a struggle that could take 7-10 days. I am not putting out that number to you just so that you can obsess over shorting it. It is intended to open your eyes to bullish opportunities as the futures move higher. ______ UPDATE (May 6, 5:30 p.m.): Big players sat out the round, presumably amusing themselves while scalpers and day traders spent the entire session kicking each other in the nuts. As much was predictable when overnight action bogged down in tedium, as though there were nothing of interest going on in the real world. It also came as no surprise when the trading world’s midgets an dwarves sent the futures into a gratuitous dive in the final hour. Please wake me when technical traders and machines programmed by nerds who have never traded anything in their lives have burned themselves out and price action returns to abnormal, the way we like it. _______ UPDATE (May 7, 9:25 p.m.): The futures are bound for a minimum 2929.00, the likeable target shown in this chart. If I say any more, it’ll ruin it.
ESM20 – June E-Mini S&Ps (Last:2903.75)
 Posted on May 5, 2020, 9:25 pm EDT
Last Updated May 8, 2020, 9:22 am EDT
