
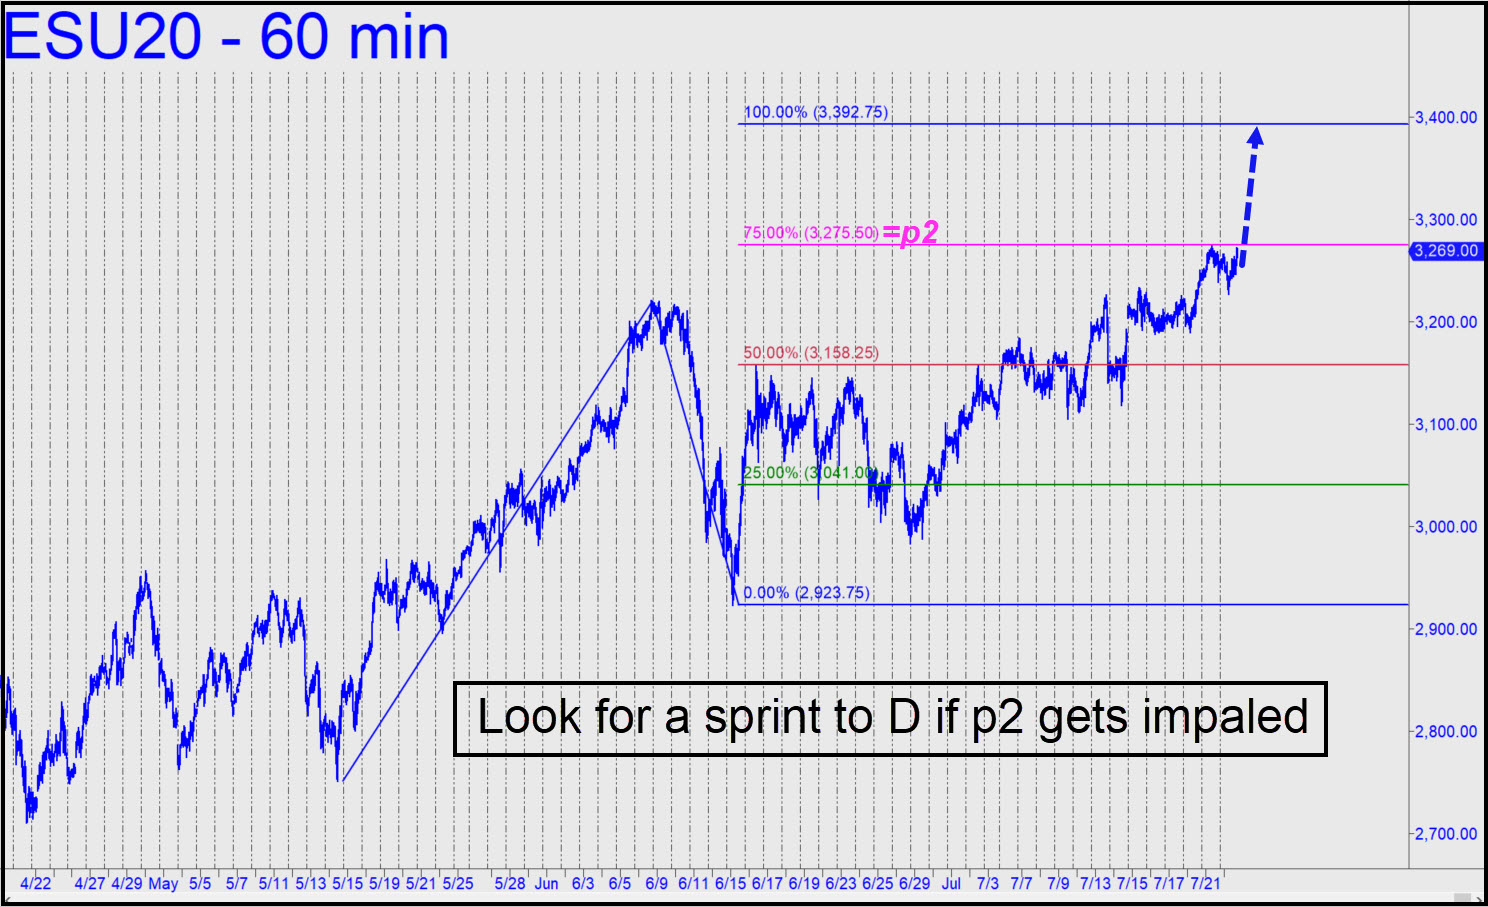
 The rally halted almost exactly at the 3275.50 ‘secondary’ pivot of the pattern shown. It would be surprising if a garden-variety pink-line, p2 pivot were to turn back the stampede begun in March, but we should be prepared for it anyway, since p2 has slain many giants in the past. My expectation, however, is for the move to hit D=3392.75, although 3370.25 could show some stopping power, That last number is the secondary pivot of a large bullish pattern begun in 2016. It comes from a continuous chart, however, and should not be expected to work with the usual decimal precision. All are shortable with tight stops. There are corresponding numbers given for the S&P 500 cash index in the tout above.
ESU20 – Sep E-Mini S&P (Last:3266.25)