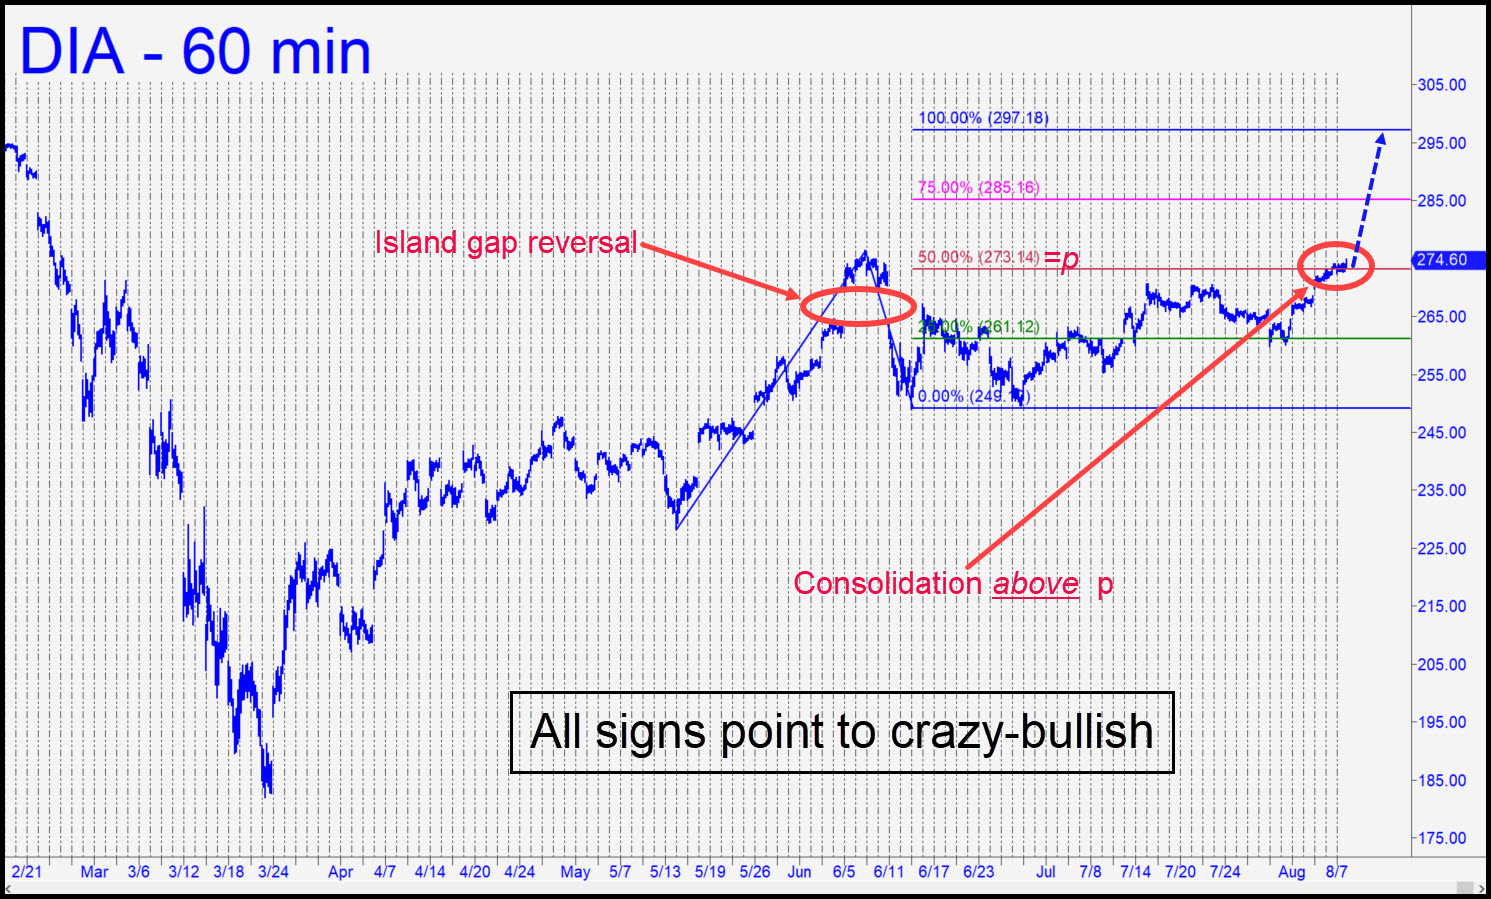
 Much as I’d hoped to find a technical glimmer of sanity, it is nowhere in sight on DIA’s intraday charts. The island-gap reversal (see inset) back in early June was ostensibly bearish, but last week’s consolidation above the gap and the midpoint Hidden Pivot of the very bullish pattern shown suggests bears are in for at least a few more weeks of brutally tough love. Friday’s pop above p was slight, but the fact that DIA closed above it, and that this occurred on the high end of the week’s final hourly bar, suggests that bulls are as revved up as they were in early April, before they embarked on the most powerful and financially consequential rally in history. The 297.18 target shown would leave the Dow just a hair shy of 30,000, and there’s no point in fighting it. Our trading bias will remain bullish for the foreseeable future, presumably via ‘mechanical’ entries of a lesser degree than the chart shown. A pullback of one full HP level, however unlikely, would be a screaming ‘mechanical’ buy. _______ UPDATE (Aug 12, 4:38 p.m. ET): Buyers are closing on p2=285.16 (see inset) — a good place to look for a tradeable stall, especially if you’ve been long on the way up. _______ UPDATE (Aug 19, 8:40 p.m.): The 285.16 rally target and the trade remain valid, although today’s drop occurred with DIA having gotten no higher than 281.76.
DIA – Dow Industrials ETF (Last:277.52)
 Posted on August 9, 2020, 5:20 pm EDT
Last Updated August 19, 2020, 8:40 pm EDT
