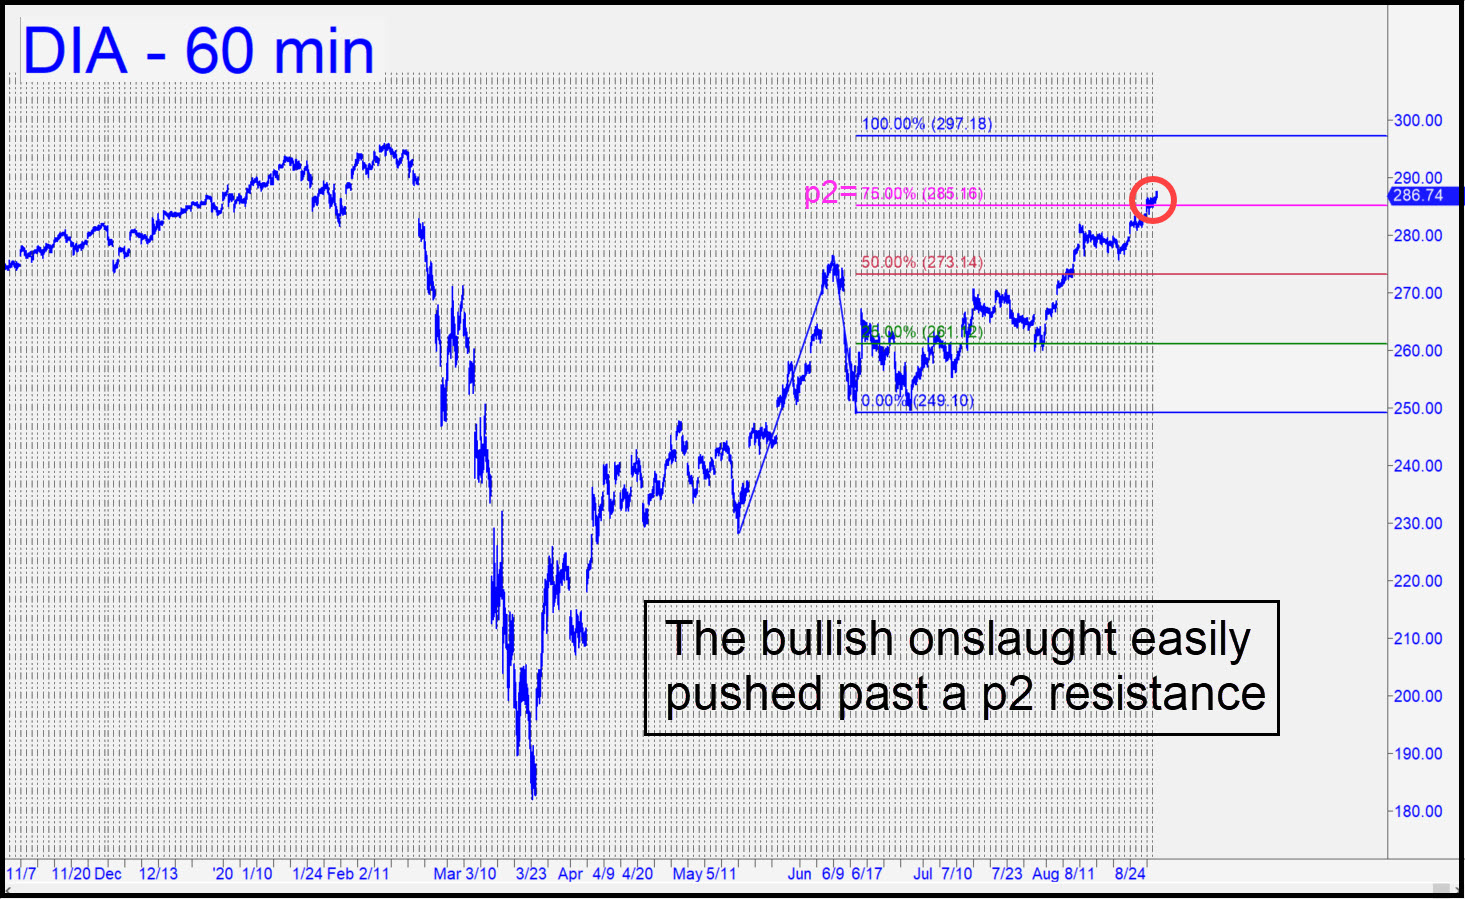
 Buyers brushed aside a secondary pivot at 285.16, turning it into an apparent support by week’s end. The clear implication is that DIA will achieve the 297.18 target, putting the cash Dow just below 30,000. I wouldn’t count on round-number resistance to halt the stampede for long, especially since the bull market projection I’ve flagged for the E-Mini S&Ps elsewhere on this page would equate to around Dow 31,000. DIA’s ascent, although not quite as steep as the Nasdaq 100’s, has provided no opportunities to get long ‘mechanically’ on the daily chart, although there have been several set-ups on the lesser charts. They cannot usually be foreseen a day in advance, however, so we’ll have to continue looking for them intraday. Meanwhile, I would not suggest buying naked call options merely because this vehicle is a lead-pipe cinch to reach the rally target. Instead, focus on butterfly spreads centered on or very near the target. The Sep 18 296/298/300 ‘fly would be a great buy for 0.10-0.15, since it has the potential to return perhaps 1.50-1.80 with DIA trading near the target between Sep 16-18. You might also consider calendar spreading the 300 strike. The Sep 25/Sep 11 for 0.60 would yield excellent odds, since it could widen to as much as 3.00. _______ UPDATE (Sep 2, 9:29 p.m.): The trade ideas suggested above have already produced significant gains, but because they attracted no discussion whatsoever, I have no way of knowing whether dozens of subscribers are keen to jump on put options when DIA hits 297.18, which it will. _______ UPDATE (Sep 3, 10:06 p.m.): Today’s big selloff did not significantly alter the odds of DIA achieving the 297.18 target, although a further drop exceeding 275.87 would.
DIA – Dow Industrials ETF (Last:283.34)
 Posted on August 30, 2020, 5:11 pm EDT
Last Updated September 3, 2020, 10:07 pm EDT
