 I’ve been a hard-core deflationist and dollar bull for decades, and so I’ve been eager to see technical evidence that the dollar’s wrenching correction since March is at an end. Alas, although there are faint stirrings in the greenback that hint of a short-to-intermediate-term rally, I doubt that it heralds the resumption of the dollar’s long-term bull market. My expectation is that this will occur in conjunction with a deflationary implosion that will usher in a global economic depression.
For the time being, though, the money spigot is wide open, fiscal stimulus is at unprecedented levels and few are worried about a ruinous debt deflation. It is inevitable nonetheless because too many dollars are owed — including more than a quadrillion of them tied to financial derivatives — for debtors to slip the noose. The sum is vastly more than the piddling trillions being loaned or gifted to the financially strapped. And although no one thinks they or even the taxpayers will have to repay this money — meaning it is ultimately inflationary, at least in theory — the deflationary black hole created by a collapsing derivatives market and falling prices for energy and real estate will suck all debt into the void of singularity.
Stochastic Blahhhs
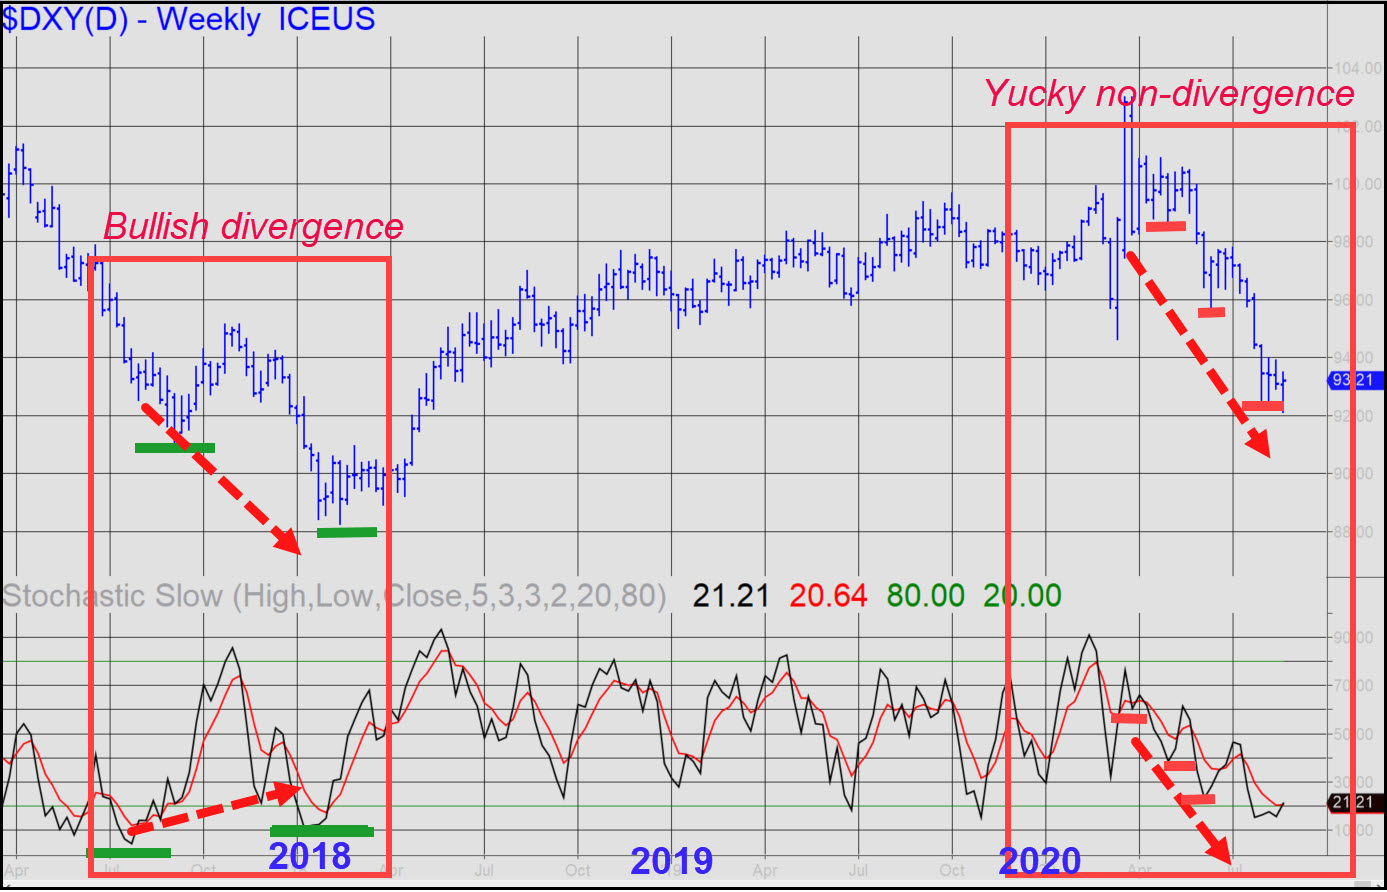
Concerning the Dollar Index, its last few, minor rallies have exceeded prior peaks on the intraday charts, and this is bullish. However, stochastic indicators do not suggest that a major reversal is at hand. Notice in the chart (inset) that DXY’s descending lows since March have generated correspondingly descending lows in the weekly stochastic. Although this ‘non-divergence’ is not bearish per se, it is not the kind of chart action we should expect at a major low. In contrast, notice how just before the dollar took off at the beginning of 2018, we saw lower lows in DXY that corresponded to rising stochastic lows. This is a bullish divergence, and it telegraphed the two-year rally that culminated in March. It is a common feature of nearly all important reversals, but it is simply not in the dollar’s chart at present. _______ UPDATE (Aug 31, 506 p.m. ET): The Dollar Index will have a chance to reverse its seemingly endless slide from the 91.69 Hidden Pivot support shown in this chart. This could happen as early as Tuesday. _______ UPDATE (Sep 1, 5:58 p.m.): Interesting, to put it mildly. DXY has bounced sharply from within 6 cents of the 91.69 Hidden Pivot correction target flagged above. The rally hasn’t gone very far yet, but it’s potentially a promising start. Don’t forget this technical reason on the weekly chart for a turn from exactly where it occurred today. _______ UPDATE (Sep 9, 11:58 p.m.): Bulls will face their first test since the dollar took off ten days ago in the form of the ‘d’ correction target at 93.10 shown in this chart. Even if this Hidden Pivot fails to hold, it would not necessarily be bearish, since the strong rally warrants more than a two-day pullback to recharge.

