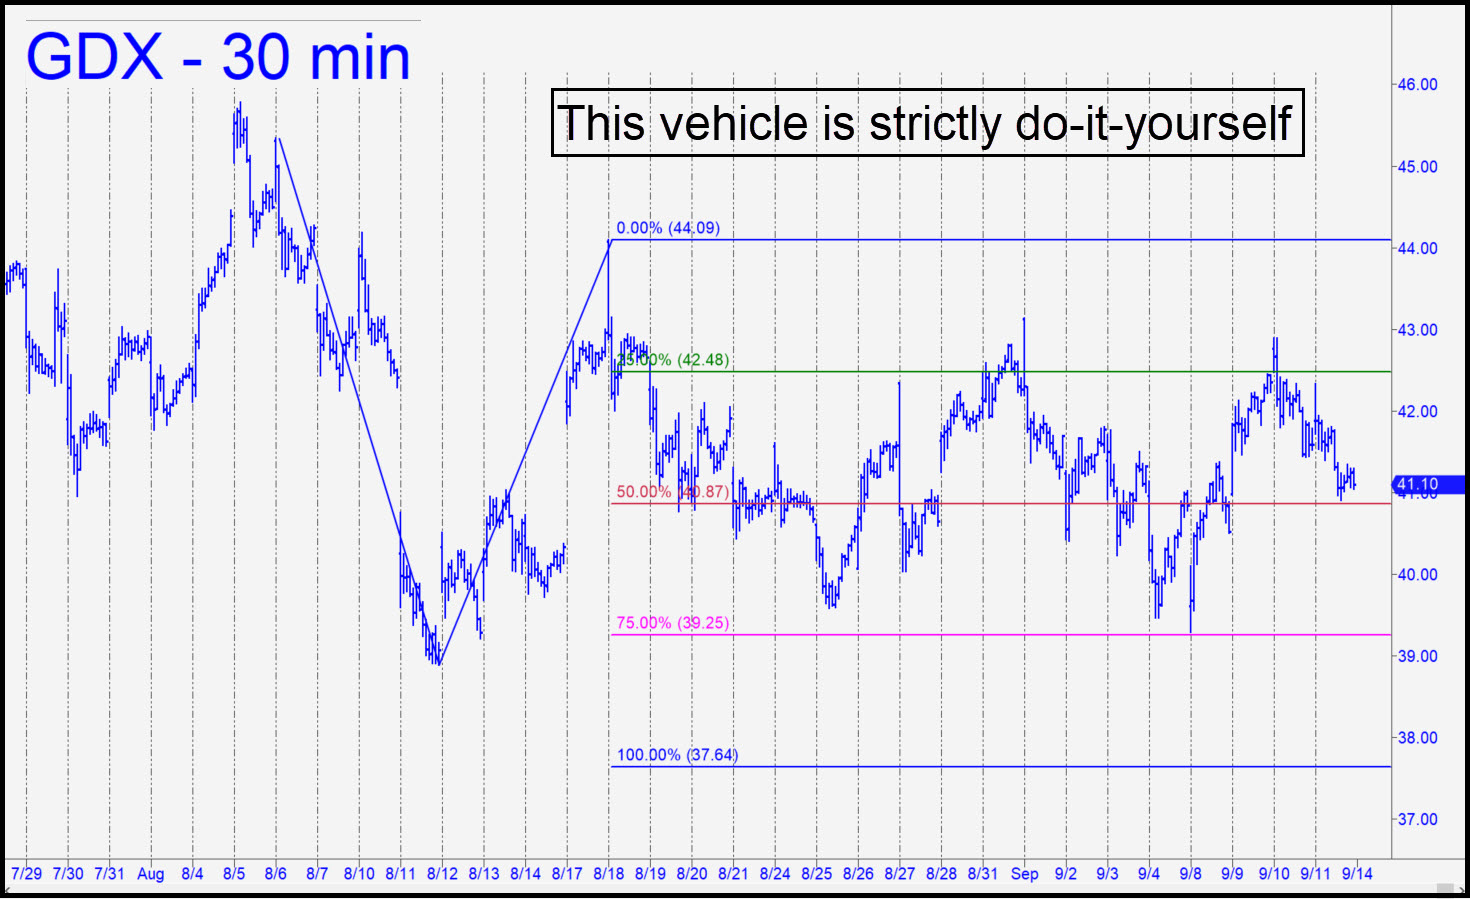
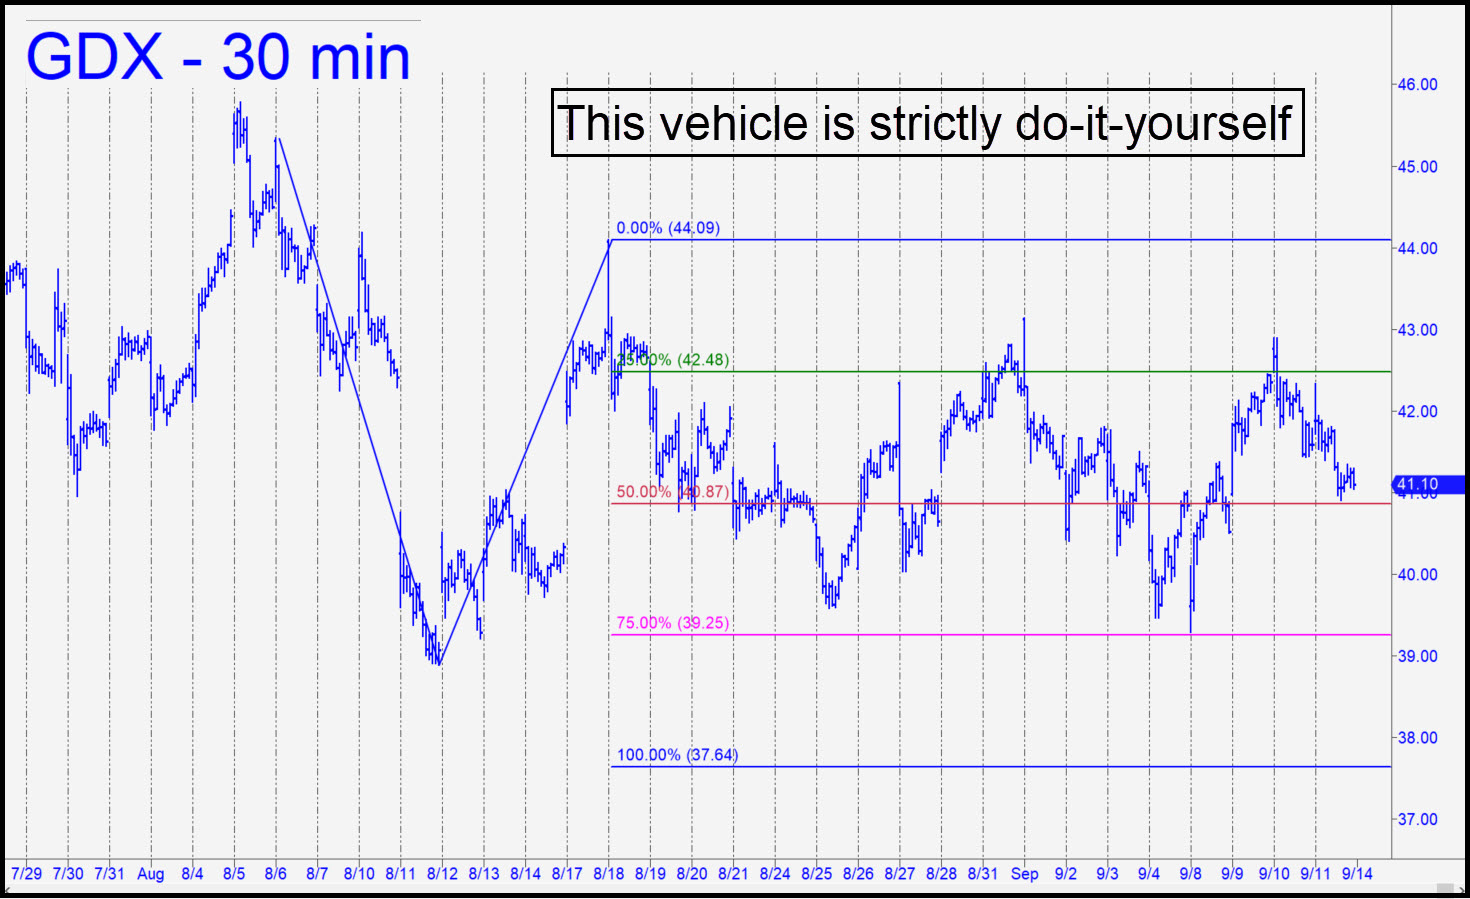
 I am leaving a GDX tout on the home page as a place-holder, having outsourced the trading of this vehicle to anyone in the chat room who is interested. It is too flaky and tedious to warrant the attention I’d need to give it in order to catch an important low or high. There have been none of either since early August, and although that could change without warning, monitoring the 15-minute chart to discern the instant of opportunity is more trouble than it’s worth. That said, if the constipated correction pattern shown in the chart were to fall to the 37.64 target, I’d be an eager buyer there. Subscribers will have learned by now that moves in the opposite direction — i.e., up — have failed on a dozen occasions to produce the sustainable breakout we’ve long anticipated. Even so, a print at 44.28 should not be ignored, since it would signal the start of an upthrust to at least 47.80. ______ UPDATE (Sep 15, 5:03 p.m.): I’ll lower the bar somewhat with this chart. If GDX can close for two consecutive days above p=43.35, that would be good evidence of an impending move to the 47.80 target. _______ UPDATE (Sep 20): Here’s an updated chart to remind you of what could happen if sellers were to seize the advantage, however briefly. The 37.64 target was first broached a week ago (see above) and remains viable, as does the upside target at 47.80. _______ UPDATE (Sep 21, 9:01 p.m.): Today’s plunge stopped just shy of negating the bullish target at 47.80, but for the time being we’ll focus on the unachieved downside target at 37.64, which seems more likely to be reached than the former at present. _______ UPDATE (Sep 23, 10:15 p.m.): The downdraft overshot the 37.64 target by 29 cents, implying GDX is fated to take another leg down. Even so, I’d suggest trading the 5-minute chart, which would turn mildly bullish on a thrust exeeding 37.98.
GDX – Gold Miners ETF (Last:37.64)