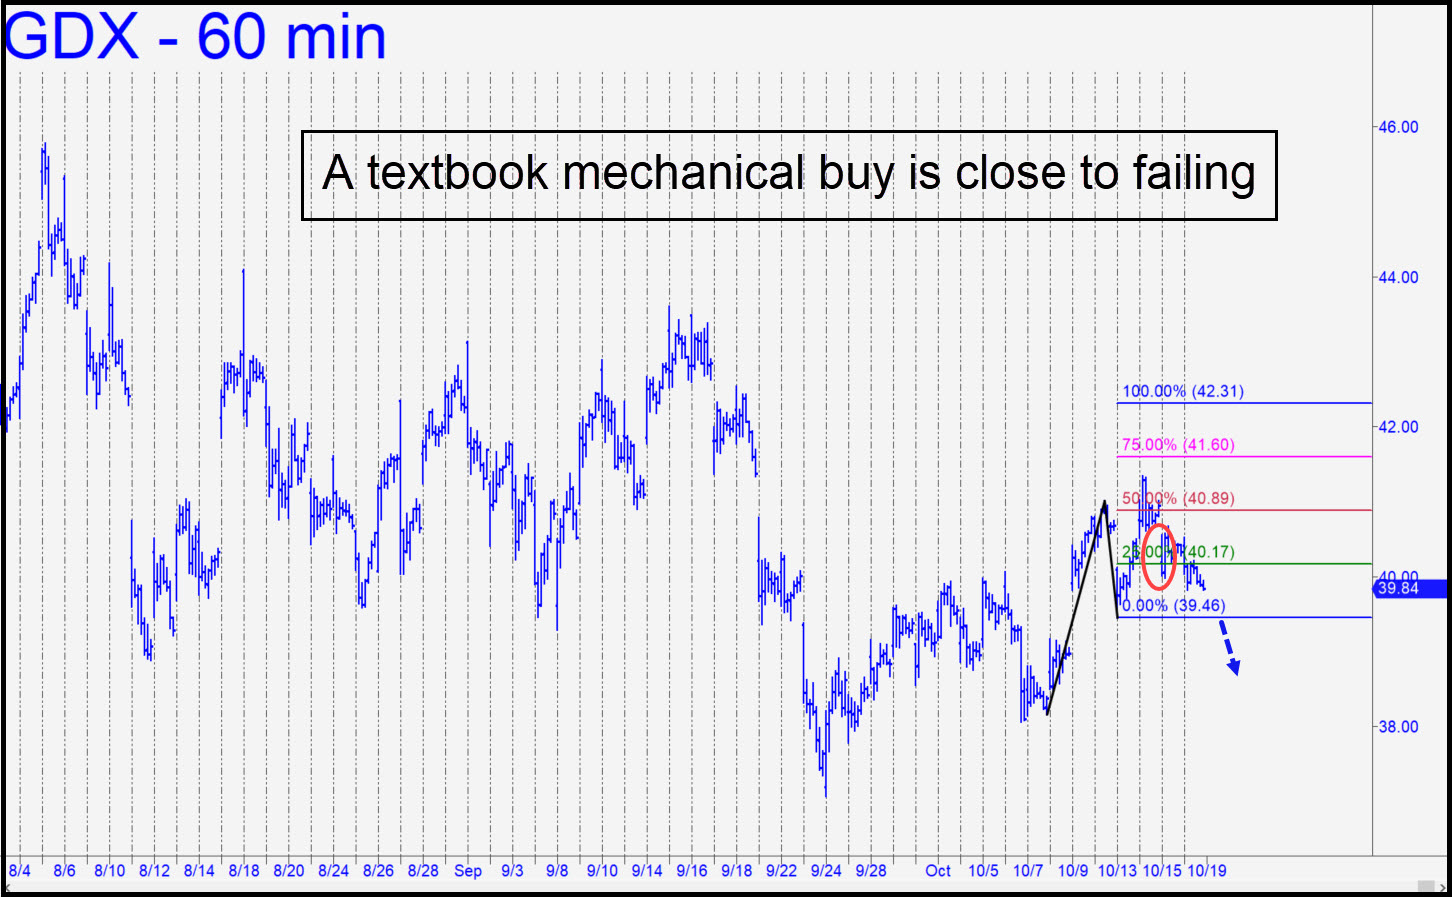
 GDX has been regularly disappointing us for more than two months and is close to doing it again. Although the stock tripped a ‘textbook’ mechanical buy on Thursday when it pulled back to the green line, it pulled back even more on Friday and ended the week just inches from breaching the point ‘C’ low of the bullish pattern. I hadn’t recommended the trade to begin with because my recent updates placed the burden of proof on bulls. And so it shall remain until such time as buyers can push this cinder block above the 42.54 ‘external peak recorded September 18 on the way down. I long ago crowdsourced the trading of this vehicle to subscribers because it became an annoyance and a burden to track it. Even so, I will respond to any posts in the chat room seeking guidance for a potential trading opportunity based on the Hidden Pivot Method. _______ UPDATE (Oct 22, 4:47 p.m. ET): Sellers not only destroyed the bullish pattern, they’ve turned its point ‘C’ low into a resistance. In any case, I’m relieved to have crowdsourced this cinder block months ago. Lest I tempt you toward despair, however, I should mention that the big picture is still bullish and capable of generating a rally to as high as 51.54. Here’s a chart that shows how. _______ UPDATE (Oct 29, 10:47 p.m.): Please give me a nudge in the chat room when it’s safe to go back in the water. What a disaster! _______ UPDATE (Nov 5, 9:42 p.m.): With today’s strong leap, GDX became an odds-on bet to reach the 43.24 midpoint Hidden Pivot of this pattern. We’ll be able to tell better when it gets there whether buyers have bigger plans, implying a further push to as high as 50.47. _______ UPDATE (Nov 9, 7:06 p.m.): The worst plunge since March left the bullish pattern projecting to 43.24 intact but shaky. While a print down at 36.00 would negate it, two larger bullish patterns going back to the March low at 16.18 would remain theoretically viable.
GDX – Gold Miners ETF (Last:38.88)
 Posted on October 18, 2020, 5:04 pm EDT
Last Updated November 14, 2020, 10:59 am EST
