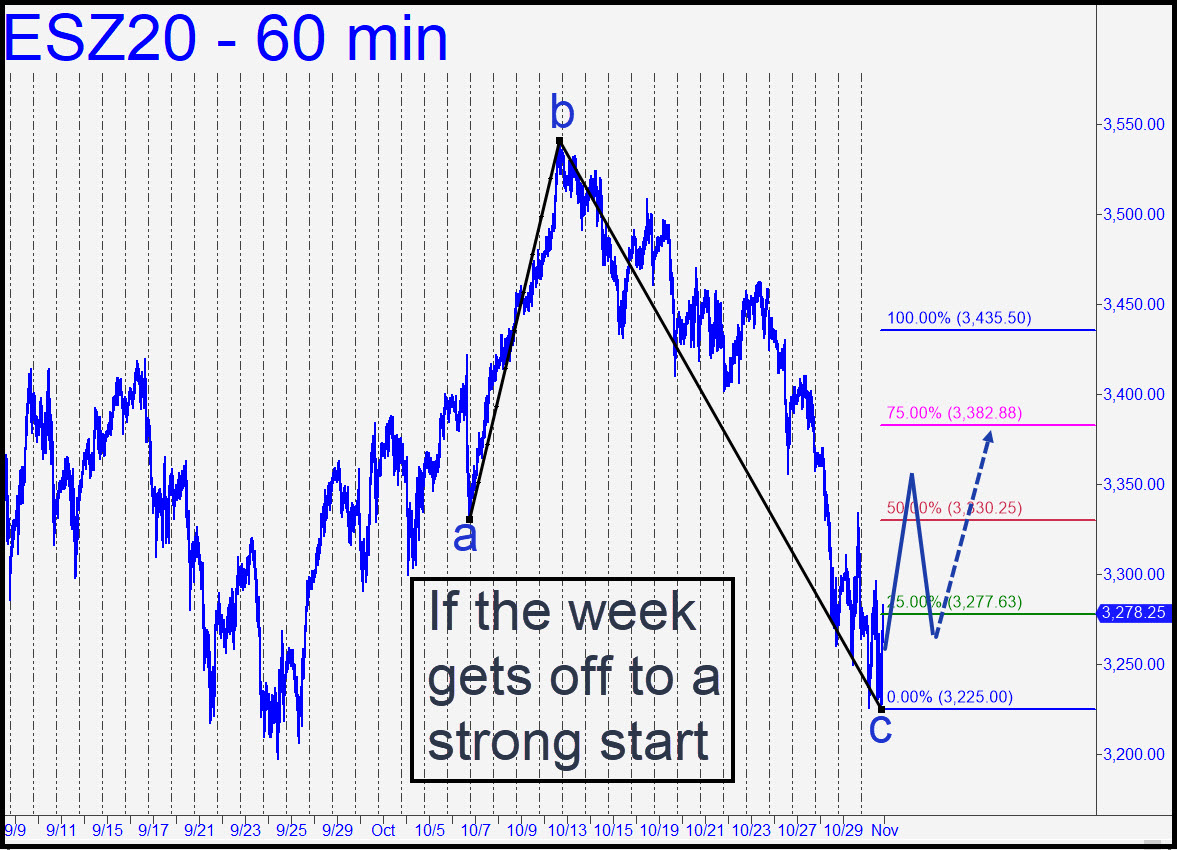
 A 100-point drop into the void would present an interesting ‘rABC’ opportunity to bottom-fish, but I’ll wait for it to happen before I try to offer timely guidance in the chat room. In the meantime, we can divide our attention with the pattern shown, a ‘reverse ABC’ that can be traded just like its conventional cousin. I’ve sketched in a hypothetical ‘mechanical’ entry if the week should get off to a strong start. Ordinarily I’d say investors are too jittery to pull it off, but on Friday they tripped two theoretical buy signals with successive rallies to the green line, implying bulls were feisty enough to at least fake themselves out. ______ UDPATE (Nov 2,8:54 p.m. ET): The opening hour generated a bullish impulse leg on the hourly chart but no easy opportunities. I take the upbeat finishing stroke a day ahead of the election as a vote for Trump. _______ UPDATE (Nov 4, 9:47 p.m. ET): The 3435.50 target provided in the chart served well as a place to get short, as some subscribers evidently did. The 119-point plunge from within three points of the pivot could have been worth as much as more than $5900 per contract to night owls paying close attention. The subsequent rally was even more dramatic, pointing toward a move now to at least 3500.13. That’s the midpoint resistance of a pattern on the daily chart that began with A= 2972.00 on 6/29. If the futures get by it, a push in to ‘no man’s land’ around 3560 would be a good place to look for a short. Set it up with a ‘reverse ABC’ pattern on a chart of 15-minute degree or less. _____ UPDATE (Nov 15, 8:48 pm.): Today’s powerful thrust slightly exceeded the 3500.13 target given above before pulling back just an inch. I’ll still need to see a two-day close above the pivot to certify the pattern’s 3802 target as likely to be reached, but it would not be illogical for the futures to retrace from here and consolidate for a few days.
ESZ20 – December E-Mini S&P (Last:3494.00)
 Posted on November 1, 2020, 5:18 pm EST
Last Updated November 5, 2020, 8:48 pm EST
